

When Does Forex Market Open? (2026 Update)
Learn when the forex market opens and closes, how Sydney, Tokyo, London and New York sessions work, and how overlaps, DST and holidays affect trading activity.
SEP 18, 2026
00
Blogs
Last updated: august 13, 2026 at 12:53 pm
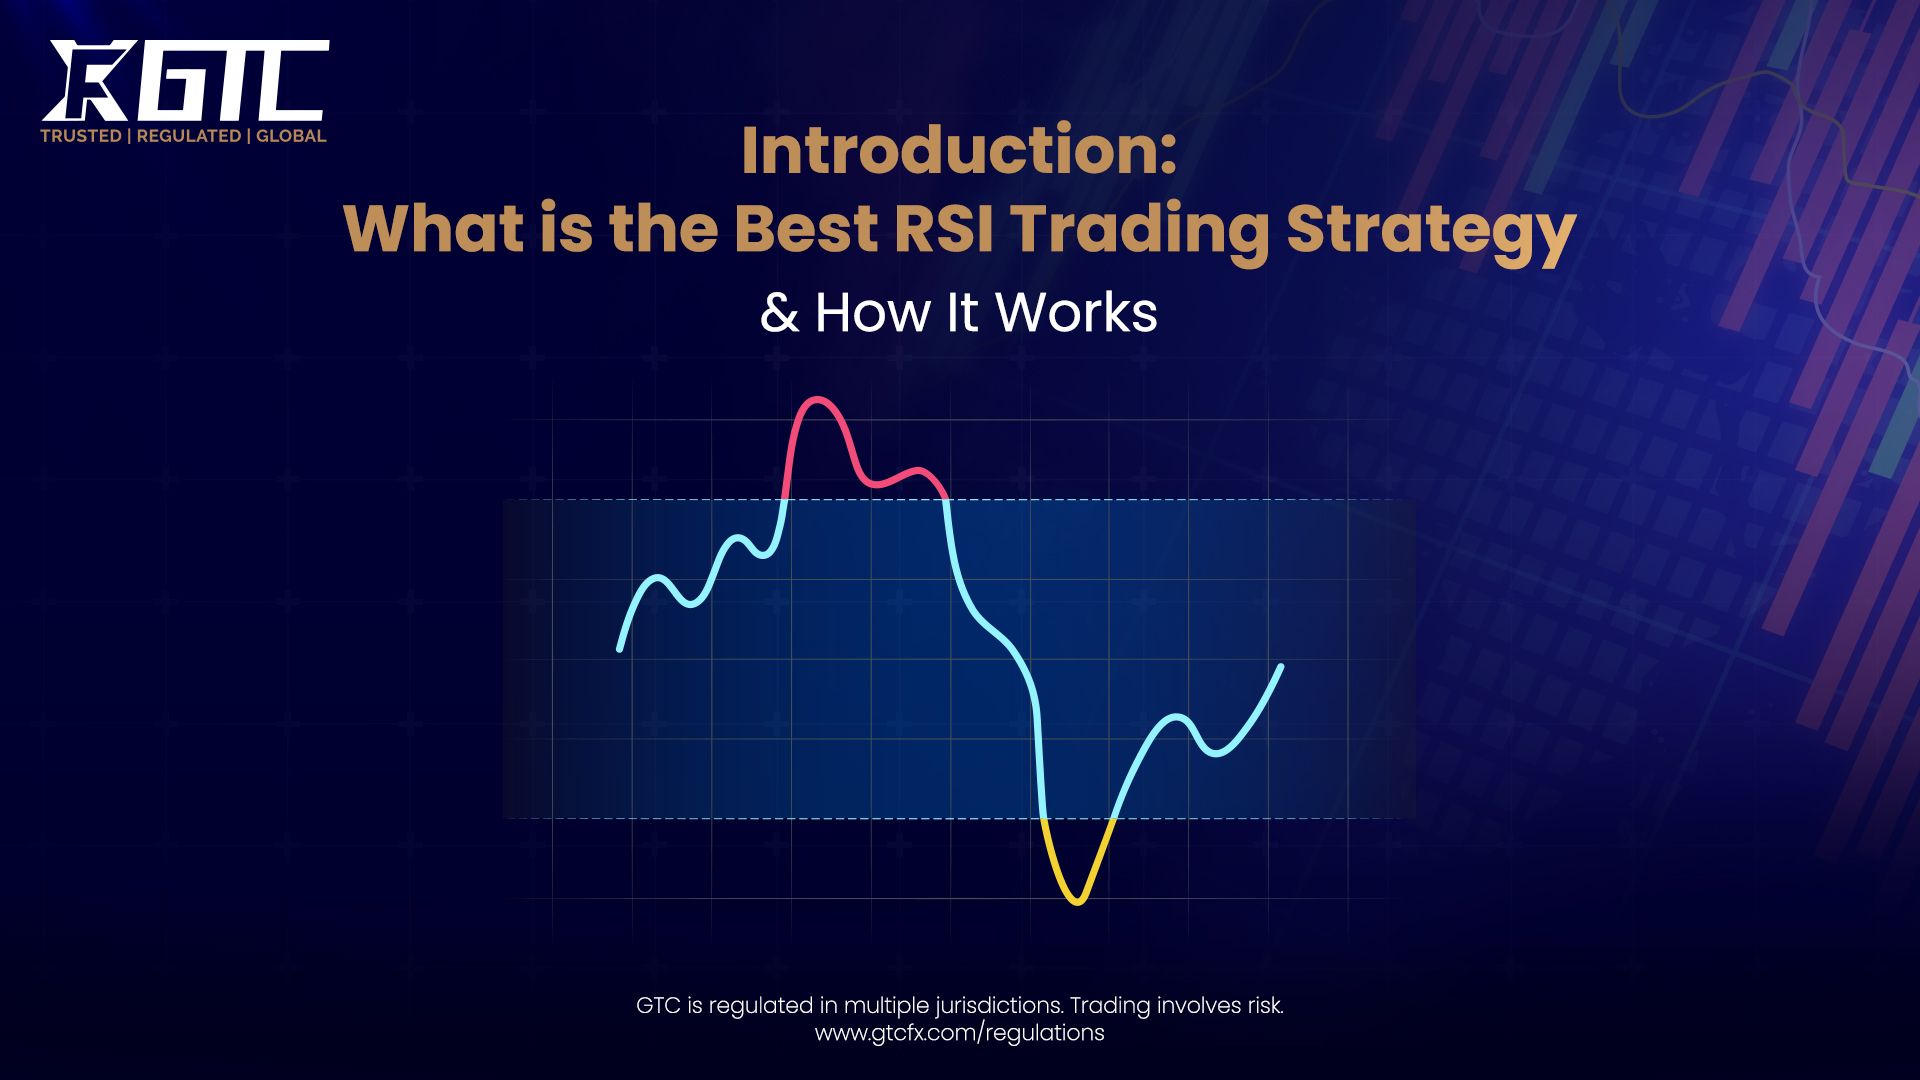
The Relative Strength Index (RSI) stands as one of the most powerful momentum indicators in technical analysis today. Whether you're trading stocks, forex, or cryptocurrency, understanding RSI trading strategy fundamentals can transform your trading performance significantly.
For those new to the market, learning what is forex trading for beginners provides a solid foundation before diving into advanced RSI strategies. This comprehensive guide explores proven RSI trading strategies, their mechanics, and actionable techniques to identify profitable market opportunities.
The RSI indicator measures the speed and magnitude of price movements on a scale from 0 to 100. Developed by J. Welles Wilder in 1978, this momentum indicator revolutionized how traders identify trend reversals and market extremes.
Understanding why forex liquidity matters and how to measure it can further enhance your ability to interpret RSI signals, especially in fast-moving markets. For more insights and resources, visit GTCFX to strengthen your trading knowledge.
This remains the most commonly used RSI trading strategy among beginners and professionals alike. The approach identifies when assets reach price extremes that suggest imminent reversals.
How Overbought/Oversold Works:
Trading Setup for Oversold Conditions:
When RSI falls below 30 and the price shows bullish reversal candlestick patterns (hammer, engulfing), traders can enter long positions. Combine this signal with increasing trading volume for stronger confirmation. Place stop-loss below the recent swing low.
Trading Setup for Overbought Conditions:
When RSI rises above 70 and bearish patterns form (shooting star, hanging man), consider short positions. In strong uptrends, use an 80 threshold instead of 70 to avoid premature exits. Set stop-loss above the recent swing high.
Important Consideration: In strong trending markets, RSI can remain overbought or oversold for extended periods without reversing immediately. This is why confirmation signals matter tremendously.
RSI divergence represents one of the most powerful reversal signals available to technical traders. This strategy identifies discrepancies between price and RSI momentum, signaling weakening trends before price reverses.
Bullish RSI Divergence Pattern:
When you spot bullish divergence, wait for the RSI to cross above 30 as additional confirmation. Look for bullish candlestick patterns like inverse hammers or engulfing patterns. Entry points work best when price retests support levels while RSI shows strength.
Bearish RSI Divergence Pattern:
Bearish divergence becomes most reliable near resistance levels where price rejection frequently occurs. Volume confirmation (decreasing volume during price rise) strengthens the signal significantly.
Hidden RSI Divergence for Trend Continuation:
Unlike classic divergence signaling reversals, hidden divergence confirms trend continuation:
These signals suggest healthy pullbacks within existing trends rather than complete reversals. Using hidden divergence improves your ability to catch trend continuation moves profitably.
Combining RSI with moving averages creates a powerful filtering system that dramatically reduces false signals. This RSI trading strategy balances momentum detection with trend confirmation.
The RSI + MA Strategy Framework:
Step 1 - Identify Trend Direction:
Apply a 50-day moving average to your chart. When price trades above the 50 MA, the trend is bullish; below, it's bearish. This filter prevents you from trading against the primary trend.
Step 2 - Time Entry with RSI Pullbacks:
In uptrends, wait for RSI to pull back to 30-40 range temporarily, then cross back above these levels. In downtrends, watch for RSI to rise to 60-70, then cross back below.
Step 3 - Execute Entry Orders:
Statistics on Accuracy: Backtesting shows that this combination improves signal accuracy from 62% (RSI alone) to 78-80% when properly configured.
Professional Setup - The 10/20 EMA with RSI:
Buy Signal: 10 EMA crosses above 20 EMA + RSI above 50 = enter long
Sell Signal: 10 EMA crosses below 20 EMA + RSI below 50 = enter short
The Relative Strength Index is a technical oscillator that calculates the magnitude of recent price changes to evaluate overbought or oversold conditions. The RSI formula compares average gains against average losses over a specified period, typically 14 days, producing values between 0 and 100.
Key RSI Components:
The indicator doesn't predict future price direction; rather, it highlights momentum extremes where reversals frequently occur. Professional traders combine RSI signals with price action and support/resistance levels to validate trading setups.
RSI functions as a relative strength calculator comparing buying pressure to selling pressure. When prices rise sharply over the period, RSI climbs toward 100. Conversely, during sharp declines, RSI approaches zero.
The RSI Calculation Formula:
This mathematical foundation ensures RSI reflects momentum accurately across different market conditions. The indicator excels in mean-reverting markets where prices tend to bounce between support and resistance levels repeatedly.
Day traders require faster, more responsive indicators to capture intraday moves. Standard RSI (14) moves too slowly for this timeframe.
Optimal Day Trading Settings:
Using RSI(9) on 5-15 minute charts generates quicker signals for intraday traders. Adjust thresholds to 75/25 or 80/20 because shorter RSI periods create more extreme swings. This responsiveness allows traders to exploit small price moves before reversals occur.
Swing traders hold positions for several days, capturing medium-term price swings. They require smoother RSI readings with fewer false signals.
Optimal Swing Trading Settings:
| Trading Duration | RSI Period | Timeframe | Thresholds |
|---|---|---|---|
| Short-term (1-5 days) | 9-14 | 4-hour charts | 70/30 |
| Medium-term (5-15 days) | 14-21 | Daily charts | 70/30 |
| Long-term (15+ days) | 21-25 | Daily/Weekly | 70/30 |
Best Setting for Most Swing Traders: RSI(14) on 4-hour or daily charts with 70/30 thresholds works exceptionally well. This balance provides reliable signals without excessive noise from intraday volatility.
Advanced Tip: Combine RSI(14) for medium-term trades with RSI(21) for longer confirmation. If both RSIs align (both overbought/oversold), the signal strength increases dramatically.
Long-term investors holding positions for weeks or months benefit from smoother, more reliable RSI readings.
Optimal Position Trading Settings:
Longer RSI periods filter short-term noise while highlighting significant momentum shifts. A 21-period RSI on daily charts identifies only major overbought/oversold conditions worthy of position changes.
Why RSI Signals Fail: Common Pitfalls
Use Multiple Confirmations:
Never trade RSI signals alone. Combine with:
Apply Risk Management Strictly:
Adapt Settings to Market Conditions:
Document and Backtest Everything:
Keep trading journals recording:
Backtesting your specific setup on historical data builds confidence and reveals which strategies work consistently on your preferred assets.
Professional traders often use multiple RSI periods simultaneously on the same chart to filter signals and identify stronger setups.
1. The Three-Level RSI System:
Entry Signal Example: RSI(21) above 50 (bullish) + RSI(14) shows bullish divergence at support + RSI(7) bounces from below 30 = high-probability long setup.
Combining RSI with MACD (Moving Average Convergence Divergence) creates extremely reliable reversal signals when both indicators align.
Setup Process:
Specific Entry Rule: When bearish RSI divergence aligns with MACD crossing below its signal line, shorting becomes highly probable. The convergence of two momentum indicators provides strong confirmation.
Extensive research from quantified trading strategies provides valuable insights about RSI effectiveness:
Key Backtesting Statistics:
| Metric | Result |
|---|---|
| Win Rate (RSI 2-6 period) | 91% |
| Accuracy (RSI + MA combination) | 78-80% |
| Accuracy (RSI alone) | 62% |
| Best RSI Period | 2-6 days (short-term) |
| Optimal Timeframe | Daily bars |
| Asset Class Performance | Stocks > Forex > Crypto |
| Average Gain Per Trade | 0.82% |
| Max Historical Drawdown | 33% |
Important Finding: Backtesting proves shorter RSI periods (2-5 days) outperform the default 14-period setting on stocks. This counter-intuitive result surprises many traders expecting smoother, slower indicators to work better.
Performance Across Different Markets
Scenario: Stock XYZ in downtrend; price makes lower low at support level while RSI makes higher low than previous bottom.
Trading Process:
Execution Details:
Order fills at 50.10 as price recovers. Confirm entry by watching RSI cross above 30. Exit half position at first resistance (51.50) for partial profit. Trail remaining position with a 5% stop-loss until RSI shows bearish divergence.
Outcome: Entry at 50.10 → first target 51.50 (1.4 profit) → second target 52.00+ possible
Scenario: Stock ABC in strong uptrend; RSI reaches 80 (extreme overbought) at resistance level.
Trading Process:
Execution Details:
Short entry fills at 145.40. Confirm RSI crosses below 70. Take partial profit at first support (143.00) for 2.4 profit. Trail remaining position for bigger move potential.
Outcome: Short at 145.40 → first target 143.00 (2.4 profit) → ultimate target 141.00+ possible
The best RSI trading strategy combines technical analysis fundamentals with disciplined risk management. Whether you choose overbought/oversold trading, divergence identification, or moving average combinations, success requires consistent application and continuous refinement.
Critical Success Factors:
The Relative Strength Index (RSI) is a powerful tool for spotting overbought/oversold conditions and momentum divergences. Traders often combine RSI with other analysis, just like understanding base vs. quote currency strengthens forex strategies. Managing risk, position sizing, and leverage, as explained in forex risk management and leverage in forex trading guides, is crucial.
Start with paper trading your RSI setup for 20–30 trades while tracking results, similar to calculating pips and lots. Once consistent, move to small real-money trades after preparing the necessary documents required to open a forex account. Focus on mastering one RSI strategy at a time. Start today and see how RSI can improve your trading results.
1. What is the best RSI indicator setting for trading?
Research consistently shows RSI periods between 2-6 work best for trading stocks, not the default 14. However, the optimal setting depends on your timeframe and trading style. Day traders use RSI(7-9), swing traders use RSI(14), and position traders use RSI(21-25). Always backtest on your specific asset before trading.
2. Can RSI predict future price movements?
RSI doesn't predict future prices; it identifies momentum extremes where reversals frequently occur. Combined with price action and support/resistance levels, RSI increases reversal probability from 60% to 75-80%. Think of RSI as a probability enhancer, not a price predictor.
3. Is RSI accurate for cryptocurrency trading?
Yes, RSI works reasonably well for cryptocurrencies, especially when combined with volume analysis and moving averages. However, crypto's 24/7 trading and extreme volatility require adjusted settings. Use RSI(14) on 4-hour or daily charts with 80/20 thresholds in strong crypto trends.
4. What's the difference between RSI 14 and RSI 21?
RSI 14 reacts more quickly to price changes, generating more frequent signals suitable for short-term trading. RSI 21 produces smoother readings, filtering out noise and generating fewer but more reliable signals for swing and position trading. Neither is inherently "better"; choose based on your holding period.
5. How do I know if my RSI strategy is working?
Track these metrics in your trading journal:
• Win rate: Target at least 55-60%
• Average profit: Should exceed average loss
• Risk/reward ratio: Target minimum 1:1.5
• Maximum consecutive losses: Should stop strategy if exceeds 5-6
• Monthly profit: Target consistent positive returns
Add as a preferred source on Google
Learn when the forex market opens and closes, how Sydney, Tokyo, London and New York sessions work, and how overlaps, DST and holidays affect trading activity.
SEP 18, 2026

In forex trading, timing can make the difference between a smart entry and a costly mistake. But with prices moving constantly, how can traders spot meaningful…
SEP 18, 2026

Explore the strongest currencies in 2026 by nominal value, including the Kuwaiti dinar, Bahraini dinar, Omani rial, Jordanian dinar and British pound, plus the…
SEP 17, 2026
-Open Your Account in Minutes-
Get instant access to global markets, advanced charting, and expert insights. Whether you're a beginner or a professional, your next opportunity starts here. Secure, regulated, and transparent.
