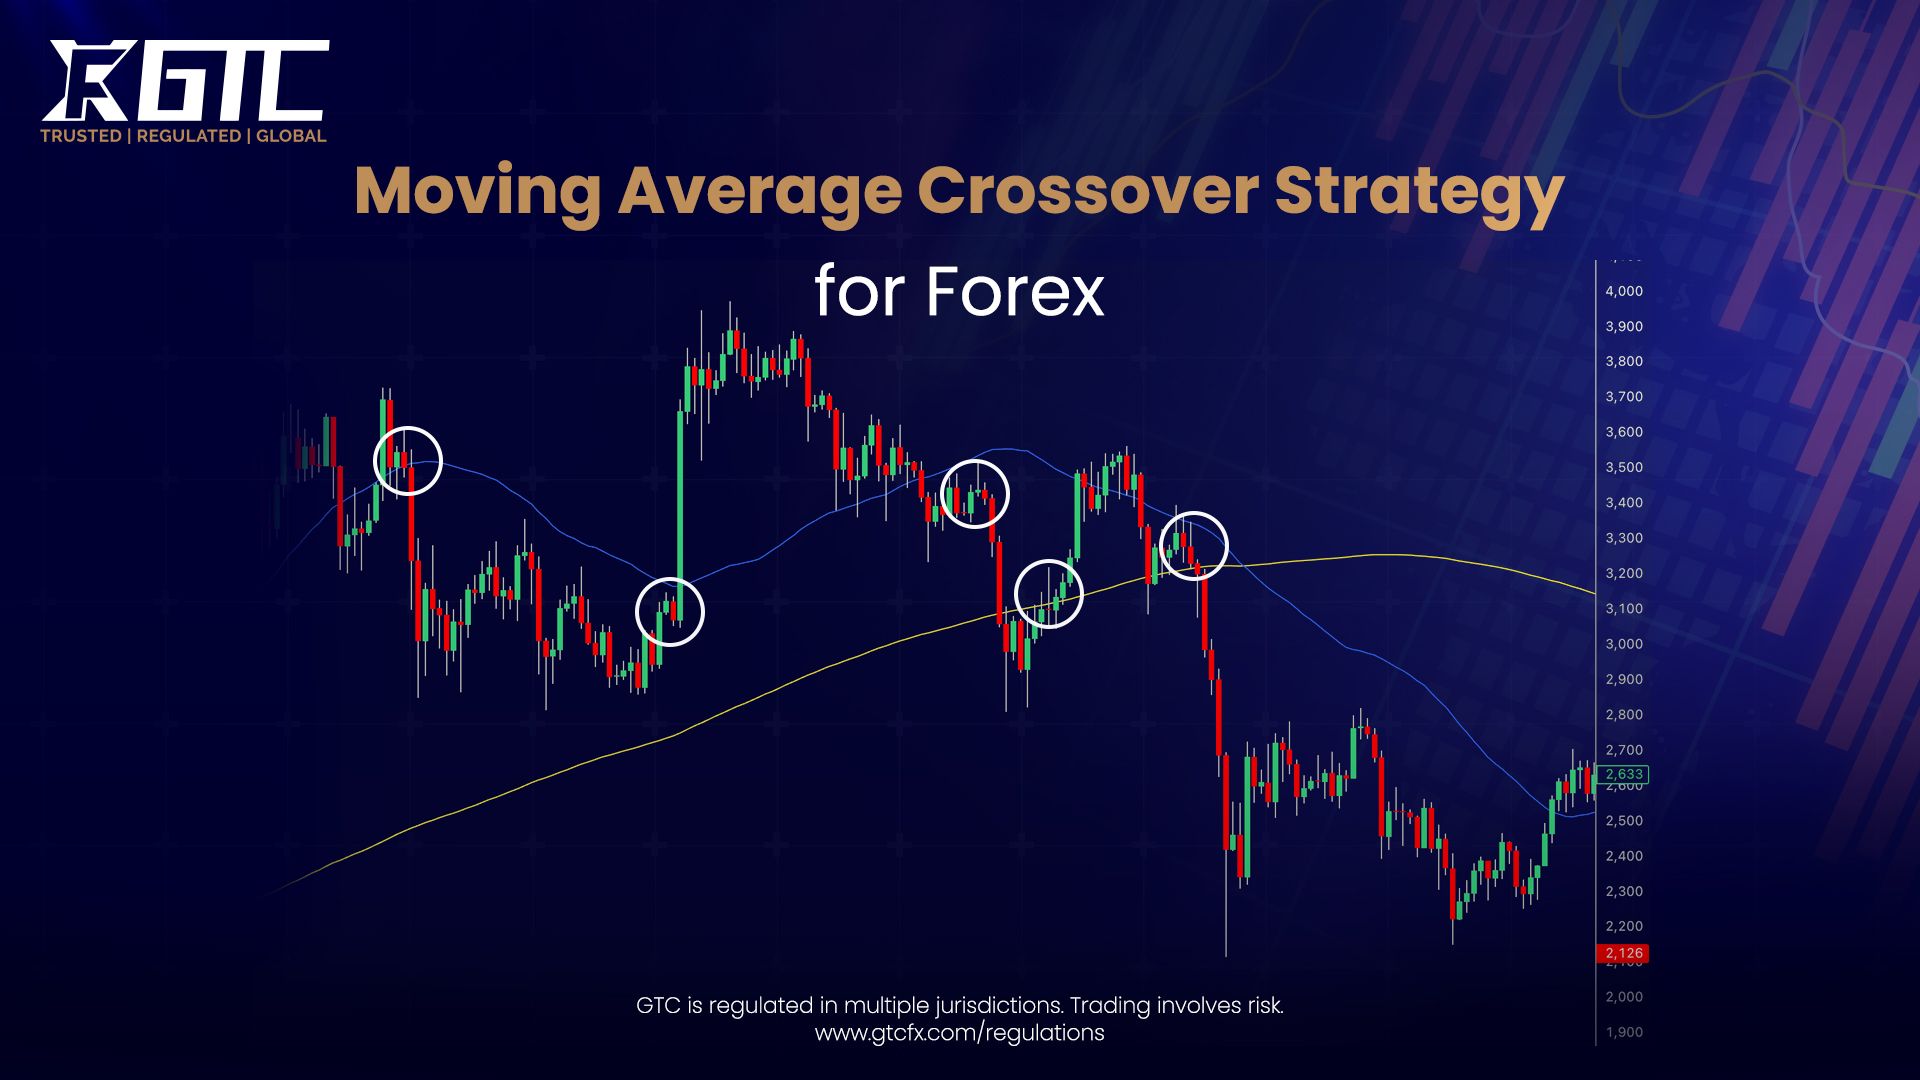
The GTCFX research team claims that the Moving Average Crossover Strategy is a popular forex trading method that uses two moving averages, one short-term and one long-term, to identify trend changes.
When the shorter MA crosses above the longer MA it signals a potential buy and when it crosses below it indicates a sell. This simple yet effective strategy helps traders capture the main trend while filtering out market noise.
Top 5 Moving Average Crossover Strategy for Forex
1
Simple Moving Average (SMA) Crossover
How it works:
- Uses two SMAs - a short-term (e.g., 10-period) and a long-term (e.g., 50-period).
- Buy signal: Short-term SMA crosses above long-term SMA.
- Sell signal: Short-term SMA crosses below long-term SMA.
Why it works:
Smooths price action, ideal for trend-following in medium- to long-term trades.
Best for: Trending markets.
2
Exponential Moving Average (EMA) Crossover
How it works:
- Uses EMAs that give more weight to recent prices (e.g., 12 EMA and 26 EMA).
- Buy signal: 12 EMA crosses above 26 EMA.
- Sell signal: 12 EMA crosses below 26 EMA.
Why it works:
Reacts faster to price changes, reducing lag compared to SMA.
Best for: Short- to medium-term trading and volatile markets.
3
Triple EMA (TEMA) Crossover
How it works:
Uses three EMAs to reduce lag and smooth out price action:
- TEMA short (fast), TEMA medium, TEMA long (slow).
- Trade signals occur when the fast TEMA crosses the slow TEMA.
Why it works:
Reduces false signals during choppy market conditions.
Best for: Active traders who want smoother signals with less noise.
4
MACD Crossover (Moving Average Convergence Divergence)
How it works:
- MACD = 12 EMA − 26 EMA, with a 9-period signal line.
- Buy signal: MACD line crosses above the signal line.
- Sell signal: MACD line crosses below the signal line.
Why it works:
Combines trend-following with momentum analysis.
Best for: Trend confirmation and identifying strong price momentum.
5
Weighted Moving Average (WMA) Crossover
How it works:
- Uses WMAs that give more weight to recent data. Example: 10 WMA and 30 WMA.
- Buy signal: Short WMA crosses above long WMA.
- Sell signal: Short WMA crosses below long WMA.
Why it works:
Provides a faster response than SMA, helping traders catch early trend reversals.
Best for: Intraday trading and faster-moving currency pairs.
Forex Trend Following Moving Average Crossover Strategy
The forex trend-following moving average crossover strategy focuses on trading established trends rather than predicting them.
Traders first identify the trend using price structure, looking for higher highs and higher lows in uptrends or lower lows and lower highs in downtrends.
Moving average crossovers then confirm the trend and help time entries, while support and resistance levels guide profit-taking. By waiting for multiple confirmations, such as MA alignment, support bounces, and positive RSI divergence, traders reduce false signals and improve their win rate, even if entries occur later in the trend.
Confirmation Focus
By waiting for multiple confirmations, such as MA alignment, support bounces, and positive RSI divergence, traders reduce false signals and improve their win rate, even if entries occur later in the trend.
Moving Average Crossover Scalping Strategy Forex
The moving average crossover scalping strategy in forex aims for rapid profits from small price movements using short timeframes and quick exits. Traders often use 1-minute or 5-minute charts with a 5 EMA and 20 EMA combination, focusing on multiple small wins instead of chasing large moves.
This strategy works best during high-liquidity sessions, such as the London and New York overlap, when spreads are tight and execution is fast. The GTCFX team recommends combining moving average crossovers with price action signals, like pin bars or engulfing candles at moving average levels, to improve trade confirmation.
Position sizing in scalping is very conservative, typically risking only 0.5% per trade. This accounts for the higher frequency of trades and small inevitable losses, emphasizing steady account growth rather than perfection on individual trades.
Forex Swing Trading MA Cross Strategy
Forex swing trading ma cross strategy employs wider moving average periods like 20/50 SMA or 50/100 EMA on 4-hour and daily timeframes. Swing traders hold positions for several days to weeks, capturing mid-term trends that develop between major technical levels.
The entry process involves waiting for the moving average crossover to occur, then confirming with price action at key support and resistance zones. Once entered, swing traders use wider stop-losses placed beyond significant swing lows, accepting more volatility in exchange for capturing larger trends. Profit targets established at Fibonacci retracement extensions or previous swing highs where resistance likely forms.
This timeframe selection allows swing traders to work part-time within the forex market, checking positions twice daily rather than monitoring charts constantly. The reduced stress and improved work-life balance appeal to traders balancing careers with trading pursuits.
Market Conditions: When Moving Averages Work Best
Trending Markets and Moving Average Effectiveness
In trending markets whether bullish or bearish moving average crossovers perform exceptionally well because sustained directional momentum validates the signal. Price Action trading in trending environments means following the trend direction using MA crossovers as entry and exit guides rather than expecting reversals.
The GTCFX research team confirms that trending markets display several characteristics: moving averages align in proper order (all rising in uptrends), price bounces off the moving average multiple times without breaking below, and each pullback terminates at progressively higher levels. These conditions signal strong health.
To identify trending markets, traders observe RSI behavior in trending markets, RSI remains in overbought (>70) or oversold (<30) territory for extended periods, occasionally touching these extremes multiple times without reverting to neutral zones. In contrast, ranging markets show RSI bouncing between 40-60 repeatedly.
Ranging Markets and False Signal Avoidance
Ranging or sideways markets are difficult for moving average strategies because price moves between support and resistance without a clear trend.
This creates frequent false crossovers and whipsaws, where trades quickly hit stop-losses as price reverses. Tools like declining ATR and narrowing Bollinger Bands can help identify these range-bound conditions.
The GTCFX team recommends avoiding trades during sideways markets and waiting for a breakout with strong volume. Once price breaks support or resistance, the resulting trend offers more reliable moving average crossover signals, helping traders protect capital and focus on higher-probability setups.
Entry Signals in Moving Average Crossover Trading
The most basic entry rule triggers on a moving average crossover: buy when the shorter MA crosses above the longer MA, and sell when it crosses below. However, the GTCFX team's professional approach adds confirmations to filter false signals:
Entry Approaches
Immediate entry approach:
Traders enter on the bar where the crossover occurs, accepting the highest risk but capturing the trend's earliest stage. This aggressive method suits traders with large accounts and high risk tolerance.
Close confirmation approach:
More conservative traders wait for the candle containing the crossover to close, confirming the signal with a full bar close beyond both moving averages. This delays entry but filters some false signals.
Pullback entry approach:
The most patient traders wait for price to pull back to the faster moving average after the crossover, using this as a secondary entry point with better risk-reward characteristics. A bullish candlestick pattern at the MA such as a pin bar or hammer provides additional confirmation.
Entry confirmation indicators strengthen signal validity:
- RSI divergence: Look for positive divergence during uptrend pullbacks (lower lows in price alongside higher lows in RSI)
- Volume confirmation: Check for increased volume on the crossover bar
- MACD alignment: Ensure MACD is positive for buy signals or negative for sell signals
- Support level confluence: Enter when MA crossover coincides with identified support zones
Exit Rules and Taking Profits
Exiting moving average crossover trades typically follows one of three methods:
Opposite crossover exit:
The simplest approach closes positions when the faster MA crosses back below the longer MA (for long trades) or back above (for short trades). While this maximizes trend capture, it often exits too late during violent reversals.
Support and resistance exit:
More sophisticated traders exit when price approaches the next resistance level (for long trades) or support level (for short trades), identified through previous swing highs and lows. This method takes profits before whipsaws develop.
Trailing stop exit:
Protective stops move upward as price rises, locking in profits while the trend continues. Once price closes below the trailing stop level, positions close. This approach captures extended trends while protecting gains.
Stop-loss placement prevents catastrophic losses:
- Below recent swing low: For uptrends, place stop-loss 20-30 pips below the most recent significant low
- Below longer MA: Use the slower moving average as a stop-loss trigger; breaking below signals trend deterioration
- Fixed percentage stop: Set stops 40-50 pips below entry for consistency across all trades
Risk-to-reward
The ideal risk-to-reward ratio targets 1:2 minimum risking $100 to make $200. This approach allows traders to profit despite win rates below 50%, as larger winners offset more frequent smaller losses.
Moving Average Confluence with Price Action Trading
The strongest moving average crossover signals occur when price action trading principles validate the technical signal. Traders look for specific candlestick patterns at moving average levels:
-
Pin bar pattern:
A candle with a long wick extending beyond the moving average body but closing above (bullish) or below (bearish) it, indicating rejection of lower/higher prices.
-
Engulfing pattern:
A larger candle completely encompassing the previous candle's range, suggesting strong momentum in the crossover direction.
-
Hammer pattern:
A reversal candle with a small body and long lower wick, typically forming at support levels (MAs), indicating buying pressure after weakness.
Incorporating Technical Analysis Forex with RSI
The Relative Strength Index (RSI) measures overbought and oversold conditions using a 0-100 scale, with readings above 70 considered overbought and below 30 oversold. For moving average crossover confirmation:
When the fast MA crosses above the slow MA during an uptrend, check RSI—if RSI simultaneously moves above 50 or shows positive divergence, the signal receives strong confirmation. Conversely, RSI above 70 might indicate extended moves prone to pullbacks.
During trend pullbacks to the faster MA, RSI dropping below 50 while price bounces creates a buying opportunity with excellent risk-reward, as the stop-loss sits just below the most recent low.
Using MACD for Momentum Verification
The Moving Average Convergence Divergence (MACD) indicator uses three components:
- MACD line: The difference between 12-period and 26-period EMAs
- Signal line: The 9-period EMA of the MACD line
- Histogram: The distance between MACD and signal line
Double confirmation
When the faster moving average crosses above the slower one, check whether MACD simultaneously crosses above its signal line and the histogram turns positive. This double confirmation significantly increases win probability.
Fundamental Analysis Forex Alongside Technical Signals
While moving average crossovers focus on technical analysis forex, pairing them with fundamental analysis forex studying economic news, interest rates, and geopolitical events prevents trading against massive momentum from economic surprises.
For instance, before entering a sell trade based on a bearish MA crossover, check whether major economic data releases are scheduled. Trading counter to central bank policy announcements or employment reports creates unnecessary risk. The GTCFX team recommends checking economic calendars before committing capital.
Support and Resistance Trading Strategy Integration
Moving average crossovers gain credibility when occurring near major support or resistance levels. A bullish MA crossover near identified resistance creates early exhaustion signals requiring confirmation. A bearish crossover near support suggests weak momentum for the downtrend.
Using Support and Resistance Trading Strategy principles as profit targets takes advantage of historical price behavior. When price rejected resistance multiple times previously, that level likely provides resistance again, making it an ideal take-profit point after bullish MA crossovers.
Risk Management in Moving Average Crossover Systems
Calculating Proper Position Size Using Pips and Lots
Understanding how to calculate pips and lots determines position sizing precision. A pip represents the fourth decimal place in currency pairs like EUR/USD (the smallest standard price movement). For one standard lot (100,000 units):
Pip value per lot
- EUR/USD: Each pip equals approximately $10
- Mini lot (10,000 units): Each pip equals approximately $1
- Micro lot (1,000 units): Each pip equals approximately $0.10
To calculate position size for a specific risk amount:
Position size formula
Position size = (Risk amount in dollars) ÷ (Stop-loss distance in pips × Pip value per lot)
If you risk $100 on a trade with a 50-pip stop-loss using standard lots ($10 per pip), the calculation yields: $100 ÷ ($10 × 50 pips) = 0.2 standard lots.
Leverage in Forex Trading and Risk Amplification
Leverage in forex trading allows traders to control larger positions with smaller capital amounts. Common leverage ratios include 50:1, 100:1, and 200:1, meaning $1 controls $50 to $200 in position value respectively. While leverage amplifies profits, it equally amplifies losses.
The GTCFX team advises avoiding excessive leverage despite its availability. A 100:1 leverage ratio seems attractive but means a 1% adverse move eliminates your entire account. Professional traders typically use 10:1 to 20:1 leverage, accepting slower wealth accumulation for sustainable long-term trading.
Stop-Loss and Take-Profit Placement Strategies
Stop-loss placement determines maximum loss per trade. The GTCFX approach suggests placing stops at logical price levels rather than arbitrary pip distances:
- Below swing lows in uptrends (prevents being stopped out by minor pullbacks)
- Above swing highs in downtrends
- Beyond the slower moving average (confirms trend deterioration if touched)
- At identified support/resistance levels (these have meaning to market participants)
Take-profit orders lock in gains at predetermined levels:
- At next resistance level (for long trades) or support level (for short trades)
- Using risk-reward ratios (targeting 2:1 or 3:1 risk-to-reward minimum)
- At Fibonacci extensions of prior swings
- Using trailing stops that progressively tighten as profits grow
The 2% Rule and Account Preservation
Professional traders follow the 2% rule: never risk more than 2% of total account capital on any single trade. For a $10,000 account, this means maximum $200 risk per trade. This conservative approach ensures that ten consecutive losses deplete only 20% of capital, allowing recovery through subsequent wins.
Risking 1% per trade provides even greater safety, especially for newer traders still developing strategy mastery. The compounding effect of consistent small wins significantly outpaces large wins followed by account-destroying losses.
What is Backtesting and Why It Matters
Backtesting involves testing trading strategies against historical price data to evaluate profitability and consistency. Rather than risking real capital to discover whether a strategy works, backtesting demonstrates performance through past market conditions. The GTCFX team emphasizes that backtesting prevents implementing strategies without evidence of viability.
Backtesting Moving Average Combinations
Historical testing reveals which moving average periods produce optimal results for specific currency pairs and timeframes. Research shows:
Research highlights
- 9 EMA / 21 EMA on 1-hour charts generated 60% win rates across EUR/USD with an average 3:1 risk-reward ratio
- 50 SMA / 200 SMA produces reliable weekly signals but fewer trade opportunities
- 5 EMA / 13 EMA on 5-minute charts suits scalping with tight spreads
TradingView Forex Strategies and Backtesting Platforms
TradingView provides built-in Pine Script functionality allowing traders to code and backtest strategies automatically. The platform's Strategy Tester feature runs your moving average crossover strategy against historical data, displaying win rate, profit factor, maximum drawdown, and other critical metrics.
Best Forex Trading Apps in India for Beginners
For Indian traders, several platforms offer excellent charting and backtesting capabilities:
- Zerodha Kite – Integrated charting with moving averages and technical indicators
- Angel Broking – User-friendly interface with backtesting tools
- TradingView – Cloud-based with comprehensive Pine Script functionality
- MT4/MT5 – Industry-standard platforms with EA programming capability
These platforms allow best scalping strategy implementation and testing before live trading.
Documents Required to Open Forex Account
Before implementing moving average crossover strategies live, traders must open accounts with regulated brokers. Required documents typically include:
- Valid government-issued identification (passport or driver's license)
- Proof of address (utility bill or bank statement within 3 months)
- Income verification (for regulatory compliance)
- Tax identification number (TIN) in your country
Forex Demo Account vs Live Account Comparison
Most brokers offer Forex Demo Accounts using virtual capital, allowing unlimited strategy practice without financial risk. This perfect environment for testing moving average strategies, refining risk management, and building trading discipline.
Forex Demo Account advantages:
- No financial risk
- Unlimited practice capital
- Identical platform and conditions to live accounts
- Psychological differences: real emotions emerge with live capital
Live Account advantages:
- Real money profits
- Forces trading discipline
- Genuine market conditions with live spreads
- Irreversible losses on mistakes
The GTCFX team recommends spending 2-4 weeks minimum on demo accounts before opening live accounts, ensuring consistent profitability on historical data.
Islamic Forex Accounts for Sharia-Compliant Traders
Islamic Forex Accounts (swap-free accounts) comply with Sharia law by eliminating overnight interest charges (swaps) that scholars consider riba (usury). This structure suits Muslim traders holding positions across multiple days without swap penalties, though spread costs slightly increase.
Get Knowledge of Moving Average Crossover in Forex
The moving average (MA) crossover strategy in forex uses the intersection of two MAs to generate trade signals. When a shorter MA crosses above a longer MA, it signals a bullish trend and potential long entry; when it crosses below, it signals a bearish trend for short positions.
This approach reduces market noise, helping traders capture the main trend rather than exact tops and bottoms.
As a lagging indicator, MA cross confirms trends after they begin, so combining it with tools like RSI, MACD, or volume analysis can improve trading outcomes, especially for beginners.
What is a Moving Average? Fundamentals for Forex Traders
A moving average (MA) smooths out price data over a set period, helping traders identify trends without daily noise. In forex, liquidity is important, as high-volume currency pairs tend to follow technical signals more reliably.
The two main types are Simple Moving Average (SMA), which gives equal weight to all prices, and Exponential Moving Average (EMA), which emphasizes recent prices for faster reaction. EMA is usually preferred for short-term analysis, while SMA suits long-term trends.
Traders should also understand the base versus quote currency concept, as it affects pip calculations and position sizing-for example, in EUR/USD, EUR is the base and USD the quote.
While there are other moving averages like WMA and RMA, SMA and EMA remain the most widely used and backtested for crossover strategies.
Creating a Comprehensive Moving Average Crossover Trading Plan
Market Analysis Process
The GTCFX team follows a systematic market analysis process before implementing any moving average crossover trades:
Step 1: Identify market condition
Check if the market is trending or ranging using higher timeframes. Daily and 4-hour charts provide the clearest trend picture for longer-term context.
Step 2: Locate key support and resistance
Mark significant levels using previous swing highs/lows where price reversed multiple times. These provide profit targets and help identify quality setups.
Step 3: Check indicator confluence
Examine where moving averages align with established support/resistance, price action patterns form, and RSI/MACD provide confirmation.
Step 4: Plan entry, stop, and profit targets
Write precise entry price, stop-loss level (distance in pips), and take-profit level before entering. This prevents emotional decisions during live trading.
Step 5: Calculate position size
Using the stop-loss distance and risk percentage, determine position size ensuring maximum 1-2% account risk.
Daily Trading Routine
- Pre-market analysis: Review daily/4-hour chart conditions before London market open
- Session monitoring: Check for trade setups during your preferred trading session (scalpers during liquid hours, swing traders anytime)
- Trade management: Monitor open positions, trail stops as profit grows, exit on planned signals
- Post-session review: Document trade outcomes, analyze what worked and what didn't
- Weekend planning: Plan next week's key levels and potential setups
Trade Journal and Performance Tracking
Maintaining detailed trading journals creates feedback loops for continuous improvement. Record for each trade:
- Entry date, time, and price
- Moving averages that triggered the signal
- Confirmation indicators (RSI, MACD, volume)
- Exit date, time, and reason for exit
- Profit or loss in pips
- Lessons learned and improvements for next similar setup
Over 50-100 trades, patterns emerge showing which timeframes, currency pairs, and confirmation indicators produce your best results.
Advantages of Moving Average Crossovers
Simplicity and Accessibility
The greatest strength of moving average crossovers lies in their straightforward application. New traders understand the concept immediately: when two lines cross, enter a trade. This accessibility has made MA crossovers the starting point for countless trading careers.
Clear Entry and Exit Rules
Unlike subjective interpretation of price action, moving average crossovers generate mechanical signals. This removes emotion from trading decisions, allowing traders to follow predetermined rules consistently even during market stress.
Reduced Market Noise
By smoothing price data across multiple periods, moving averages filter out daily volatility noise. This prevents overtrading based on minor price fluctuations, keeping traders focused on significant trend movements.
Applicable Across Multiple Assets
The moving average crossover strategy works effectively on stocks, crypto, commodities, and forex. Professional traders often apply identical strategies across multiple markets simultaneously, leveraging skills across asset classes.
Backtesting Evidence
Extensive historical testing confirms that simple MA crossover strategies produce positive expectancy over long periods. This evidence-based foundation provides confidence when facing inevitable losing streaks.
Combines Well with Other Indicators
Moving averages integrate seamlessly with RSI, MACD, price action patterns, Fibonacci retracements, and other tools. This flexibility allows customization based on individual trading style and market preferences.
Disadvantages and Limitations
Lagging Indicator Nature
Moving averages necessarily lag price action since they calculate historical averages. By the time moving averages cross, significant price movement has already occurred. In fast markets, the crossover signal comes too late to capture the best portions of moves.
False Signals in Choppy Markets
Ranging or consolidating markets generate numerous whipsaw crossovers that result in quick losses. As the GTCFX team emphasizes, trading trending markets requires identifying trends first, something MA crossovers cannot reliably do.
Whipsaw Losses
Price frequently reverses sharply after moving average crossovers in choppy conditions. Traders suffer stop-loss hits, then watch price reverse in their original direction, the classic whipsaw that frustrates mechanical system traders.
Ineffectiveness in Low-Volatility Markets
When price moves sideways between tight bands, moving averages compress together and crossovers become meaningless. These quiet periods offer no edge for MA systems.
Requires Confirmation to Avoid Losses
Pure moving average crossover systems historically show mediocre performance without additional confirmation. This means successful trading requires combining MAs with other technical tools, negating the "simplicity" advantage for optimal results.
Cannot Identify Reversal Strength
Moving average crossovers indicate direction changes but not momentum strength. A weak crossover generates identical signals as a strong crossover, even though the latter has a higher probability of sustained trending.
Parameter Optimization Challenges
Selecting optimal moving average periods involves testing numerous combinations. What works perfectly during backtesting might fail in future markets due to changing market conditions and over-optimization.
Expert Notes • Tables • FAQs
Expert Tips and Notes from GTCFX Research Team
Tip 1: Combine Multiple Timeframes for Confirmation
The GTCFX team recommends checking moving average positions across multiple timeframes. If the daily chart shows a Golden Cross (50/200 SMA) and the 4-hour chart simultaneously displays a bullish EMA crossover, the probability of a sustained move increases substantially. This multi-timeframe confirmation prevents trading minor pullbacks within larger downtrends.
Tip 2: Use Volatility to Adjust Stop-Loss Distances
Rather than fixed stop-loss distances, adjust them based on current volatility using Average True Range (ATR). During high volatility periods, the place stops farther away to avoid whipsaws. During calm periods, tighter stops capture profits more quickly. This dynamic approach maintains consistent risk-reward ratios regardless of market conditions.
Tip 3: Trade the Entire Trend, Not Just the Entry
The GTCFX research emphasizes that successful traders focus less on perfect entries and more on position management. Once entered on a moving average crossover, the trail stops at each swing low, allowing price to run as far as it will go. This "trend riding" approach captures extended moves that generate account-doubling profits.
Why This Blog Is Beneficial: GTCFX Expert Perspective
The moving average crossover strategy represents foundational knowledge that every forex trader must master. According to GTCFX research, traders combining moving average systems with proper risk management, market condition analysis, and confirmation indicators experience dramatically improved profitability compared to those trading subjectively.
This comprehensive guide provides the exact framework the GTCFX team uses to educate professional traders, distilling years of research into actionable knowledge.Beyond profitability, understanding moving average crossovers develops technical analysis thinking patterns applicable to all trading contexts.
Traders learn to think in terms of trends, momentum, confirmation, and price structure-universal concepts transcending specific indicators or market conditions. The GTCFX educational approach emphasizes building strong fundamentals that create long-term trading success.
Pros and Cons Comparison Table
Pros and Cons Comparison Table
| Aspect |
Advantages |
Disadvantages |
| Complexity |
Simple, rule-based system |
Requires confirmation to work well |
| Signal Quality |
Clear entry/exit triggers |
Generates false signals in ranges |
| Trend Identification |
Filters market noise |
Lagging nature produces late signals |
| Learning Curve |
Easy for beginners |
Optimal use requires experience |
| Risk Management |
Clear stop-loss placement |
Must combine with other tools |
| Timeframe Compatibility |
Works across all timeframes |
Performs best in trending markets |
| Backtesting |
Extensive historical evidence |
Past performance doesn't guarantee future results |
| Flexibility |
Combines with multiple indicators |
Parameter optimization difficult |
Moving Average Strategy Comparison
Moving Average Strategy Comparison
| Strategy |
Fast MA |
Slow MA |
Best For |
Win Rate |
Risk Level |
| Golden Cross |
50 SMA |
200 SMA |
Long-term trends |
55-65% |
Low |
| 9/21 EMA |
9 EMA |
21 EMA |
Intraday/Momentum |
60-70% |
Medium |
| 5/13 EMA |
5 EMA |
13 EMA |
Short-term/Scalping |
65-75% |
High |
| 20/50 SMA |
20 SMA |
50 SMA |
Swing trading |
55-60% |
Medium |
| 10/25/50 EMA |
10 EMA |
25/50 EMA |
Triple crossover |
70%+ |
Low |
| 50/100 EMA |
50 EMA |
100 EMA |
Position trading |
50-60% |
Low |
Moving Average Optimization
Moving Average Optimization
| Parameter |
Short-term (1H-4H) |
Intermediate (Daily) |
Long-term (Weekly) |
| Fast MA |
5-13 EMA |
20-50 EMA |
50 SMA |
| Slow MA |
13-21 EMA |
50-100 EMA |
200 SMA |
| Best Currency Pairs |
EUR/USD, GBP/USD |
Any major pair |
Any pair |
| Stop-Loss (pips) |
20-40 |
40-60 |
80-120 |
| Typical Trades/Week |
10-30 |
3-8 |
1-3 |
| Win Rate Target |
55-65% |
50-60% |
55-65% |
Conclusion
The moving average crossover strategy remains one of the most effective and beginner-friendly approaches in forex trading when applied with discipline. GTCFX research shows that success comes from combining crossover signals with price action, proper risk management, and an understanding of market conditions.
Rather than searching for a perfect moving average setup, traders should focus on core principles, test strategies thoroughly, and follow clear entry and exit rules. With consistent execution and controlled risk, moving average crossovers can deliver reliable long-term trading results.
Frequently Asked Questions (FAQs)
Frequently Asked Questions (FAQs)
1. What is a moving average crossover strategy in forex?
It is a trading method where buy or sell signals are generated when a short-term moving average crosses above or below a long-term moving average, indicating a potential trend change.
2. Which moving averages work best for forex trading?
Commonly used combinations include 9/21 EMA for intraday trading and 50/200 SMA for swing or long-term trading. The best choice depends on your timeframe and trading style.
3. Do moving average crossovers work in all market conditions?
No. They perform best in trending markets and often fail during sideways or ranging conditions, where false signals are common.
4. What timeframe is ideal for moving average crossover strategies?
Higher timeframes such as 1-hour and 4-hour charts provide more reliable signals. Lower timeframes tend to generate noise and reduce accuracy.
5. Is risk management necessary with moving average crossovers?
Yes. Using stop-loss orders and risking only 1–2 percent of your account per trade is essential for long-term profitability.