

When Does Forex Market Open? (2026 Update)
Learn when the forex market opens and closes, how Sydney, Tokyo, London and New York sessions work, and how overlaps, DST and holidays affect trading activity.
SEP 18, 2026
00
Blogs
Last updated: august 13, 2026 at 12:53 pm
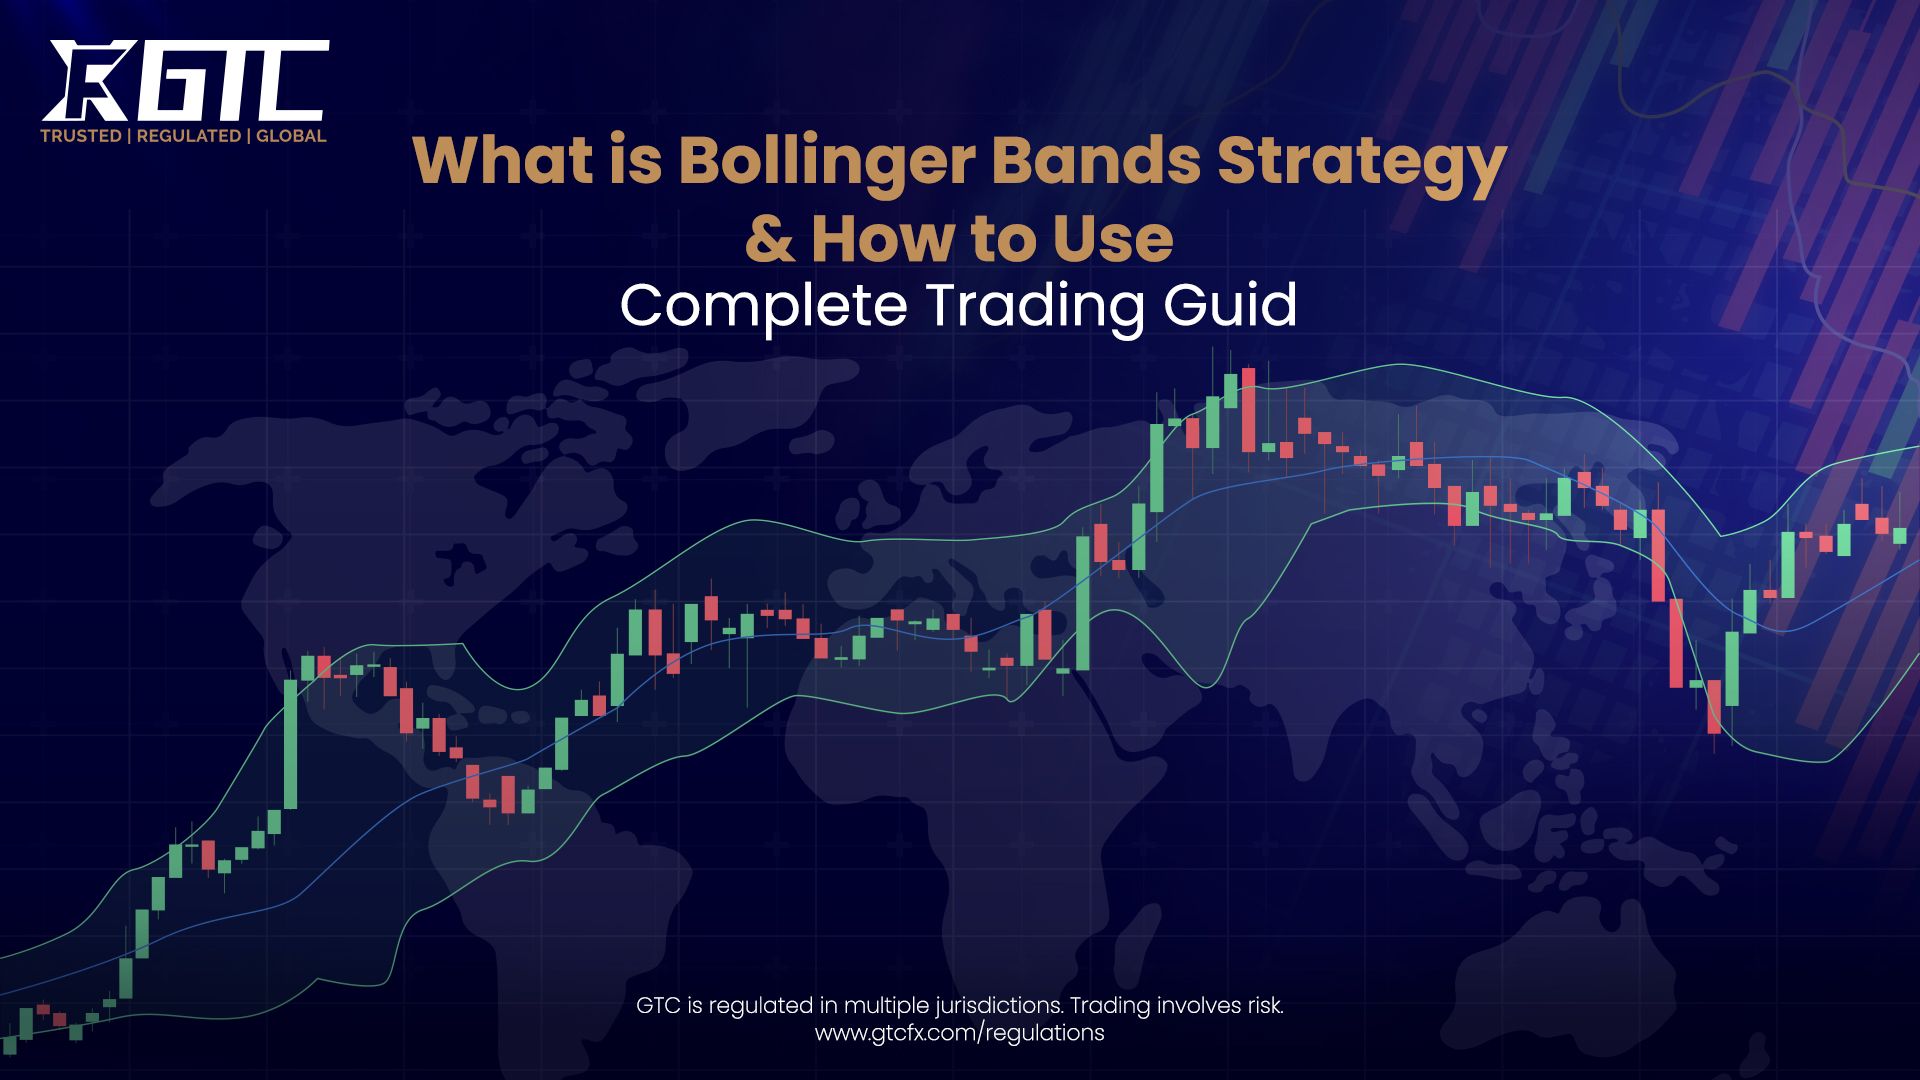
Bollinger Bands are considered among a powerful technical tool in technical analysis that is used by traders throughout the globe for the purposes of recognizing market volatility, overbought and oversold trading levels, and potentially more importantly, opportunities of a breakout. Invented by John Bollinger in the 1980s, these bands are an indispensable tool for all traders within the forex, stocks, cryptocurrency, and commodities markets.
The tool consists of three bands that expand and contract with the price movement, which makes it exceedingly suitable for finding high-probability trading signals. Most indicators are static. Bollinger Bands only contrive themselves during the changes in market dynamics from which they are efficient across different asset categories and time frames.
Traders who are new to forex can learn the basics in What Is Forex Trading? A Beginner’s Guide, while understanding market dynamics such as Forex Liquidity Distribution and Liquidity Gaps in Forex Trading can help improve the accuracy of signals derived from Bollinger Bands.
Professional traders often combine Bollinger Bands with other technical indicators like RSI (Relative Strength Index) and MACD (Moving Average Convergence Divergence) to increase signal accuracy and reduce false signals. For those looking to deepen their understanding, exploring Why Forex Liquidity Matters & How to Measure It can provide critical insights into price movements and volatility. Whether you're a beginner or an experienced trader, mastering Bollinger Bands is crucial for developing a consistent trading strategy.
The Bollinger Squeeze, which is also referred to as the "volatility squeeze," typically becomes evident when the Bollinger Bands significantly squeeze to move inside either the Keltner Channels or other volatility indicators. The constriction of these bands marks a period of low volatility and market consolidation, as it is usually followed by a violent price explosion.
While "squeezed," the price action becomes rough and sideways, bars closing inside the bands since there was no significant directional movement. This is the lull before the storm where traders are waiting, often with their fingers crossed, for the next breakout.
Step 1: Identify the Squeeze
Look for a period where the Bollinger Bands have narrowed significantly, indicating low volatility. Compare current band width to the previous 6-month average; when bands reach their lowest levels, a squeeze is confirmed.
Step 2: Wait for Confirmation
Don't enter the trade immediately after identifying a squeeze. Wait for clear breakout signals:
Step 3: Confirm with Additional Indicators
Use RSI or MACD to validate the breakout strength:
Step 4: Entry Logic
Step 5: Take Profit Strategy
After a successful breakout, price often continues the trend. Use trailing stops or target the opposite Bollinger Band as a profit-taking zone.
The reality check is most evident in Indian markets where the Nifty started a successive journey of narrow days at the commencement of February and yearly lows characteristic of a Bollinger band.
For the first time, the RSI layout was in the oversold regions. When the break took place around the upper B. B line, the net gain of the index for 10 days was 500 points. When some lucky traders earnestly committed to going as long as this breakout fell below the fast band, they were quick to witness standard profits.
In Bollinger Bouncer (or Bollinger Band Bounce) trading strategy, the idea is that prices will tend to revert toward the middle band (the 20-day moving average) once the extremes have been touched. This idea works effectively in horizontal/consolidating markets where prices move within some form of support and resistance levels.
This strategy is easy to follow and understand; in simple terms, the logic is that the lower band=bought, the upper band=overbought. When a price reaches either extreme, it results in a gentle reversal toward the middle band and leads to what is seen as a bouncing opportunity.
For Buy (Long) Signals:
Stop-Loss Placement:
Set the stop-loss just below the lower band or at recent major support. Typical stop-loss is 30-50 pips depending on market volatility.
Take-Profit Targets:
For Sell (Short) Signals:
The strategy mirrors the buy setup but in reverse:
Understanding the mathematical foundation helps traders appreciate how this indicator works:
Where:
The standard deviation quantifies the distance that means to prices and thus measures market volatility which will drive roughly 95% of normal market-bound price activity inside Bollinger Bands.
Standard deviation is the mathematical basis of the Bollinger Bands. It tells you to what extent prices have dispersed far from a moving average, providing information on whether price movements are spread out or concentrated.
Large standard deviations are good indicators of high volatility (big differences from the moving average), while small standard deviations foretell low volatility (price levels only at a small distance from the moving average).
Normally, they are calculated based on a two-standard deviation multiplier (K=2), covering around 95% of historical price data and making it statistically reliable. However, traders may modify these under 1.5 or up to 2.5 standard deviations according to variables that confirm their trading style and risk appetite.
Bollinger Bands are dynamic, (which means they answer the market's immediate situation) in terms of volatility. On seeing high market volatility, the price swing widens, and the bands bound outward. As the market reverts to calm and (consequently) price swings collapse, the bands contract inward.
Bollinger Bands, on the other hand, do not work as do static support and resistance. They tell you where support and resistance might be and how volatile the environment is.
Bollinger Band Width (BBW) is calculated as:
BBW = (Upper Band – Lower Band) / Middle Band
A narrow band width signals low volatility and potential upcoming breakout, while a wide band width indicates high volatility and potential consolidation.
Professional traders often look for "squeeze" patterns where the band width reaches its lowest level in 6 months, as this typically precedes significant price movements.
When analyzing Bollinger Bands, observe how price interacts with each component:
The 20-period SMA with 2 standard deviations is the most widely used and tested setting. It works well for swing trading and position trading on daily timeframes.
Most trading platforms default to these settings for good reason – they balance sensitivity with reliability.
For short-term traders and scalpers, faster settings are required:
These settings increase false signals but also increase trading frequency. Combine with lower timeframes (5-min to 15-min charts).
Some swing traders prefer 21-period SMA (one trading week) instead of 20. This provides better alignment with weekly support/resistance while remaining responsive.
Long-term traders use:
These settings reduce noise and focus on major trend reversals.
Key Rule: Match Bollinger Band settings to your trading timeframe. Settings that work on 1-hour charts won't work on daily charts.
The MACD (Moving Average Convergence Divergence) measures momentum and trend changes. When combined with Bollinger Bands, it gives both a volatility context and a momentum confirmation.
MACD Components:
Bullish Trading Setup:
Bearish Trading Setup:
Why This Combination Works
Bollinger Bands identify overbought/oversold zones; MACD confirms actual transformation in momentum. Though momentum might be good and the price stays near the upper line, the price could stall for a while without really going back.
However, reversal direction probability increases if the MACD line crosses the signal line.
Strategy 1: Band-Based Stops
Place stop-loss just beyond the opposite band:
This allows price to fluctuate within normal volatility without triggering stops.
Strategy 2: Support/Resistance Stops
Use recent major support/resistance levels as stop anchors, not just band levels. This acknowledges that bands are volatility measures, not absolute support/resistance.
Strategy 3: ATR-Based Stops
Use Average True Range (ATR) to set stops proportional to market volatility:
Stop-Loss = Entry Price - (2 × ATR Value)
Calculate position size based on the distance to stop-loss:
Position Size = (Account Risk %) / (Stop-Loss Distance in Pips/Points)
Example: If your account is $10,000 and you risk $200 per trade, with a 50-pip stop-loss:
Position Size = $200 / 50 = $4 per pip (or 4 micro-lots in forex)
Strategy 1: Band-Based Targets
Strategy 2: Risk-Reward Ratios
Maintain at least 1:2 risk-reward ratio:
Strategy 3: Partial Profits
Take 50% profit at first target, let rest run with trailing stop. This locks in gains while maintaining upside potential.
Forex markets have high liquidity and tight spreads, making Bollinger Bands highly effective. Pair Bollinger Bands with significant news events or economic data releases:
Best forex pairs for Bollinger Bands strategies: EUR/USD, GBP/USD, USD/JPY.
Individual stocks often exhibit cleaner patterns than indices. Bollinger Bands work well for:
Crypto markets are 24/7 with extreme volatility, making Bollinger Bands essential. Tight squeezes often precede 10-15% breakouts. Use these specific strategies:
Combine with volume profiles and support/resistance levels for best results.
Bollinger Band Walk occurs when price rides along the upper or lower band during a strong trend. This is NOT a reversal signal. Instead, it indicates strong momentum continuation.
Trading the Walk:
BBW = (Upper Band – Lower Band) / Middle Band
Watch for BBW reaching 6-month lows, then wait for expansion – this often precedes explosive moves.
Compare band width today to 20-day average:
This quantifies squeeze intensity and expansion strength.
Before entering any Bollinger Bands trade, verify these conditions:
Pre-Trade Checklist:
Exit Checklist:
Bollinger Bands are one of the ambiguous yet potential indicators in the analysis of technical. The companionastics to set the indicator in the right way are critical for producing satisfactory results. The main strategies include:
Success with Bollinger Bands requires:
Bollinger Bands are a key tool for traders across forex, stocks, and crypto, helping identify volatility and trading opportunities. Success comes from spotting setups, confirming with other signals, managing risk, and trading consistently. Combining Bollinger Bands with RSI, MACD, or volume reduces false signals, while understanding forex pips and lots helps manage positions accurately.
Start with default settings (20, 2), backtest on historical data, and adapt to your trading style. Always follow solid risk management, use multiple timeframe trends, confirm with candlestick patterns, and review performance regularly. Beginners should know the documents required to open a forex account and practice in a demo vs live account before trading real money.
With practice and discipline, Bollinger Bands can become one of your most profitable trading tools.
Q: What does it mean when Bollinger Bands are very tight?
Tight bands indicate low volatility and market consolidation. This typically precedes a significant price breakout in either direction.
Q: Can I use Bollinger Bands as support and resistance?
The outer bands (especially the lower band in uptrends and upper band in downtrends) can act as dynamic support/resistance. However, they're volatility measures, not rigid support/resistance levels.
Q: What's the best timeframe for Bollinger Bands trading?
Bollinger Bands work on all timeframes (1-minute to monthly). Match your settings to your timeframe: faster settings for lower timeframes, slower settings for higher timeframes.
Q: Should I always exit at the middle band?
No. The middle band is a reference point, not an automatic exit. In strong trends, price rides the outer band without reverting to the middle.
Q: How do I avoid false signals with Bollinger Bands?
Use volume confirmation, candlestick patterns, and combine with RSI or MACD. Never trade band touches in isolation.
Add as a preferred source on Google
Learn when the forex market opens and closes, how Sydney, Tokyo, London and New York sessions work, and how overlaps, DST and holidays affect trading activity.
SEP 18, 2026

In forex trading, timing can make the difference between a smart entry and a costly mistake. But with prices moving constantly, how can traders spot meaningful…
SEP 18, 2026

Explore the strongest currencies in 2026 by nominal value, including the Kuwaiti dinar, Bahraini dinar, Omani rial, Jordanian dinar and British pound, plus the…
SEP 17, 2026
-Open Your Account in Minutes-
Get instant access to global markets, advanced charting, and expert insights. Whether you're a beginner or a professional, your next opportunity starts here. Secure, regulated, and transparent.
