



How to Make a Forex Withdrawal on GTC Go (GTCFX Guide)?
GTC Go is GTCFX's mobile trading app, giving traders quick access to accounts, markets, and fund management. As a regulated forex broker, GTCFX aims to make ev…
OCT 15, 2026
00
Blogs
Last updated: august 13, 2026 at 1:33 pm
According to the research team at GTCFX, understanding liquidity gaps is fundamental for traders, investors, and financial institutions seeking to navigate modern financial markets with confidence.
A liquidity gap represents the critical mismatch between cash inflows and outflows within a specific time period, creating imbalances that can trigger significant price movements and operational challenges.
This comprehensive guide explores every dimension of liquidity gaps, from foundational definitions to advanced trading strategies, equipping you with the knowledge needed to identify, analyze, and capitalize on these market phenomena.
Liquidity stands as the lifeblood of financial markets, enabling smooth transactions for both buyers and sellers. When liquidity remains abundant, traders can execute positions at predictable prices without significant market impact. However, when liquidity gaps emerge—periods where buyers significantly outnumber sellers or vice versa—market conditions deteriorate rapidly.
These gaps create disparities in supply and demand, forcing traders to accept prices far removed from their expected fair value. Understanding this dynamic is essential because liquidity gaps occur across all asset classes, including stocks, bonds, cryptocurrencies, forex, and commodities, affecting every market participant regardless of trading style or experience level.
A liquidity gap in finance occurs when there's insufficient trading volume at certain price levels, creating voids in the order book. This absence of participants willing to trade at those prices forces market participants to either wait for counterparties or accept significant price concessions.
The phenomenon manifests differently across market conditions, creating unique opportunities and risks for informed traders.
What is the liquidity gap? The liquidity gap definition encompasses both the absence of trading activity at specific price points and the broader mismatch between an organization's liquid assets and its short-term liabilities. In banking contexts, the liquidity gap statement reveals whether institutions can meet immediate obligations using their available resources.
For traders, however, a liquidity gap represents a technical price pattern—regions where price moves rapidly with minimal resistance because few market participants wish to transact.
Understanding the distinction between liquidity gap vs liquidity trap proves invaluable for market participants. A liquidity trap occurs at macroeconomic levels when interest rates approach zero and monetary policy becomes ineffective at stimulating economic activity.
Conversely, a liquidity gap represents a microeconomic trading phenomenon where specific price levels lack sufficient trading interest. Additionally, liquidity mismatch in trading describes asset-liability timing discrepancies, while liquidity risk in finance refers to the broader danger of assets becoming difficult to sell or costing substantially more to liquidate than expected.
Liquidity voids represent more substantial gaps spanning multiple FVGs across higher timeframes, typically following major news events or significant institutional trading activity.
What causes liquidity gaps in trading? Several interconnected factors generate these market phenomena:
The liquidity gap impact on markets manifests through several consequences:
Liquidity gap effects on price action directly influence trader profitability. When gaps exist, prices move more dramatically through these zones.
Skilled traders recognize this dynamic and position accordingly, while unprepared market participants suffer slippage—the difference between expected execution price and actual fill price.
Research demonstrates strong correlations between liquidity gap and volatility patterns. When liquidity gaps widen, price volatility simultaneously increases, creating both risks and opportunities.
Historical analysis of market stress events consistently shows that periods of reduced liquidity coincide with abnormally elevated volatility. Understanding this relationship enables traders to anticipate more extreme price movements when liquidity visibly diminishes.
What is the gap filling in stocks? Gap filling represents the tendency of stock prices to return to their pre-gap levels after significant overnight or weekend price movements. When earnings surprises, strategic announcements, or market events occur between trading sessions, stocks open at substantially different prices. Many traders anticipate these gaps will eventually "fill" as prices revert toward fair value.
Liquidity gap in stock market scenarios typically emerge when:
Liquidity gap in forex trading frequently occurs at session boundaries. What is gap filling in stock market logic applies similarly to currency pairs. When New York markets close at 5:00 PM Eastern Time and Asian markets reopen, significant economic announcements or overnight developments can move currency pairs substantially, leaving gaps traders analyze.
Liquidity gap trading strategies in forex often involve:
Liquidity gaps in crypto trading present unique challenges due to 24/7 market operation and extreme volatility. Cryptocurrency markets never close, yet liquidity pools concentrate during peak trading hours. Liquidity gap example scenarios in crypto include:
How to identify liquidity gaps requires understanding multiple identification techniques:
Volume profile tools reveal where actual trading has concentrated historically. Zones with minimal volume represent potential liquidity gaps—areas where price can move rapidly. Traders identify peaks and valleys in volume profiles to spot supply-demand imbalances.
Direct examination of current order books reveals where traders have placed buy and sell orders. Clusters of orders create liquidity, while gaps in the order book show areas likely to provide minimal resistance. This real-time analysis helps traders predict price movement paths.
Liquidity gap indicators help traders quantify gaps and anticipate their occurrence:
Liquidity gap analysis benefits from systematic assessment:
What Are Liquidity Providers and How to trade liquidity gaps effectively requires combining multiple analytical approaches:
Successful gap traders implement rigorous liquidity gap management:
Financial institutions employ multiple liquidity gap solutions:
Liquidity risk in finance represents one of banking's most critical management challenges. Banks constantly face timing mismatches where short-term deposits fund long-term loans.
When deposits flee (bank runs) or funding markets seize, banks face acute liquidity pressure. The liquidity gap statement reveals whether institutions can cover obligations within specific timeframes.
Liquidity risk vs liquidity gap distinctions prove important for institutional risk managers:
Liquidity Risk encompasses the broader danger of being unable to access adequate funding at reasonable costs, potentially forcing unfavorable asset sales. Liquidity Gap represents the quantified mismatch between expected cash inflows and outflows during specific periods.
Basel III regulations now mandate liquidity ratio calculations:
Banks address liquidity gaps through:
Liquidity gap risks for investors manifest through several mechanisms:
Is a liquidity gap good or bad? The answer depends entirely on positioning:
While immediate liquidity gap effects on price action create sharp movements, longer-term consequences vary. Research shows that gaps frequently fill over subsequent days or weeks as market balance restores.
However, fundamental shifts in sentiment mean some gaps persist, validating the new price level.
Day traders and swing traders directly experience how liquidity gap affects traders. Unexpected gaps eliminate overnight holds, forcing liquidation at opening prices.
Professional traders hedge gap risk using overnight options strategies or currency futures, while retail traders typically absorb gap losses.
Market makers provide crucial liquidity under normal conditions, yet withdraw during gap periods when risks become extreme. When market-makers exit, liquidity evaporates further, amplifying gaps.
This creates self-reinforcing cycles where disappearing liquidity triggers additional market-maker departures.
Understanding why liquidity gaps happen requires examining interconnected factors:
The 2010 flash crash represents history's most dramatic liquidity gap event. On May 6, 2010, the Dow Jones Industrial Average dropped nearly 1,000 points in minutes, then partially recovered within 36 minutes. Investigation revealed that massive E-Mini S&P 500 selling exhausted available buyers, triggering cascading algorithmic selling as high-frequency traders escalated aggressive selling.
The cascade occurred because each algorithm saw deteriorating market structure, prompting programmatic exits that further deteriorated conditions. Market makers withdrew liquidity provision as conditions became extreme, accelerating the decline. This event demonstrated how liquidity gap causes can combine, creating systemic risks.
During major crypto price crashes, liquidity gaps in crypto trading become extreme. When Bitcoin drops 10% overnight, cascading liquidations in leveraged trading create additional selling pressure.
Exchanges experience order book depth collapse as liquidations overwhelm market participants. Traders witness $50,000-per-coin swings within minutes—price gaps that would be literally impossible during normal trading conditions.
Liquidity gap in forex trading follows predictable seasonal patterns. Monday openings frequently show weekend gaps as geopolitical developments or central bank communications shift sentiment overnight. Currency pairs experiencing gaps often show rapid mean reversion as professional traders recognize overextension and position accordingly.
Successful traders recognize that liquidity gap trading strategies require different approaches based on gap characteristics:
Certain conditions reliably predict gaps. Understanding liquidity gap causes enables proactive trading:
Advanced traders stress-test their positions against potential gaps:
Top traders adjust position sizing based on real-time liquidity observations. During identified low-liquidity periods, professional traders reduce position sizes substantially.
This simple discipline protects capital during gap events while maintaining profit potential during normal periods. Many retail traders fail because they maintain consistent sizing regardless of liquidity conditions, suffering outsized losses during gaps.
Professional traders rarely trade gaps based on single timeframe analysis. Instead, they confirm gap patterns across multiple timeframes—confirming that lower timeframe gaps align with higher timeframe structure.
This approach dramatically improves prediction accuracy and reduces false-signal trading losses.
Sophisticated traders monitor market microstructure indicators like VPIN (Volume-Synchronized Probability of Informed Trading).
These metrics quantify toxic order flow—informed trading exhausting liquidity. When VPIN spikes, experienced traders anticipate imminent liquidity deterioration and gaps.
Expert Opinions: What Industry Leaders Say
Understanding liquidity gap examples and analysis techniques provides measurable advantages:
Liquidity gaps represent fundamental market dynamics that separate successful traders from struggling ones. By understanding how gaps form, when they typically occur, and how different market participants respond, traders gain practical frameworks for navigation. The interplay between supply, demand, information asymmetry, and market structure creates predictable patterns that informed traders exploit systematically.
From banking institutions managing deposit-funded asset portfolios to cryptocurrency traders navigating volatile 24/7 markets, liquidity gap analysis provides actionable insights. The 2010 flash crash demonstrated how gaps can cascade into systemic risks, prompting regulatory frameworks like Basel III designed specifically to manage liquidity mismatches. Yet gaps also create opportunities—areas where prices disconnect from fair value temporarily, rewarding traders who understand and anticipate these disconnections.
Moving forward, market participants should prioritize building robust liquidity gap analysis capabilities. Monitor order book depth, recognize seasonal gap patterns, adjust sizing based on liquidity conditions, and use multi-timeframe confirmation before entering gap trades. Whether trading gaps or hedging against unexpected gaps, institutional knowledge proves invaluable.For advanced liquidity analysis tools, explore GTCFX.
Q1: What is a liquidity gap in the simplest terms?
A liquidity gap occurs when there are insufficient buyers or sellers at certain price levels, causing prices to jump across those untested regions. Think of it as a missing step in a staircase—prices move directly from one level to another, skipping the intermediate steps.
Q2: How do I identify liquidity gaps on my trading charts?
Look for candlestick patterns with no overlap between the previous close and current open (gaps on the chart). Observe volume profile indicators showing zones with minimal trading activity. Monitor order book depth—areas with no visible buy or sell orders represent potential gap zones.
Q3: Are liquidity gaps good or bad for my trading?
That depends on your position. Gaps moving against you create losses through slippage. Gaps moving with your position create profits. The key is positioning correctly before gaps occur and sizing appropriately based on identified low-liquidity periods.
Q4: What's the difference between a liquidity gap and a fair value gap?
Liquidity gaps represent any disconnect between prior-close and current-open prices, while fair value gaps specifically represent three-candle patterns on charts where rapid price movement leaves behind untested price zones. All FVGs are gaps, but not all gaps are fair value gaps.
Q5: How do banks use liquidity gap analysis?
Banks calculate liquidity gaps by comparing cash inflows from assets against cash outflows to liabilities across specific time periods. Regulatory requirements mandate maintaining minimum liquidity coverage ratios (LCR) and stable funding ratios (NSFR) to ensure banks can survive 30-day stress scenarios without accessing new funding.
Q6: Can I predict when liquidity gaps will occur?
Partially. Predictable gaps emerge during identified low-liquidity trading sessions (transitions between major exchanges), economic data releases, and known event dates (earnings, central bank meetings). However, surprise news always creates unpredictable gaps. Professional traders increase gap preparation during identified high-risk periods.
Q7: How do liquidity gaps differ between stocks, forex, and crypto?
Stocks display predictable overnight and weekend gaps between sessions. Forex gaps concentrate during session transitions with predictable geopolitical triggers. Cryptocurrencies trade 24/7 but show liquidity patterns concentrating during peak US and Asian hours. The gap-identification principles remain consistent across all markets, though specific timing varies.
Q8: What's the most common mistake traders make with liquidity gaps?
Retail traders typically fail to reduce position sizing during identified low-liquidity periods, then suffer catastrophic losses when unexpected gaps trigger their stops. Professional traders cut size dramatically during high-risk times, converting potential disaster into acceptable drawdowns. Position sizing discipline represents the single most impactful gap-management technique.
Add as a preferred source on Google
GTC Go is GTCFX's mobile trading app, giving traders quick access to accounts, markets, and fund management. As a regulated forex broker, GTCFX aims to make ev…
OCT 15, 2026
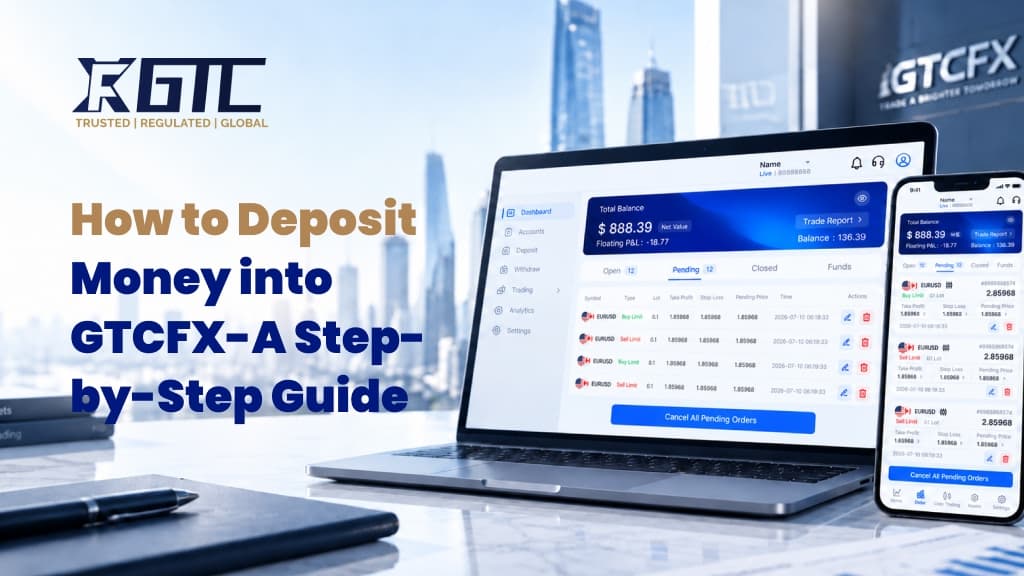
Depositing funds into your trading account is an essential step before you start trading with GTCFX. This guide explains how to deposit money into GTCFX, inclu…
OCT 14, 2026
Learn when the forex market opens and closes, how Sydney, Tokyo, London and New York sessions work, and how overlaps, DST and holidays affect trading activity.
SEP 18, 2026
-Open Your Account in Minutes-
Get instant access to global markets, advanced charting, and expert insights. Whether you're a beginner or a professional, your next opportunity starts here. Secure, regulated, and transparent.
