

When Does Forex Market Open? (2026 Update)
Learn when the forex market opens and closes, how Sydney, Tokyo, London and New York sessions work, and how overlaps, DST and holidays affect trading activity.
SEP 18, 2026
00
Blogs
Last updated: august 13, 2026 at 12:53 pm
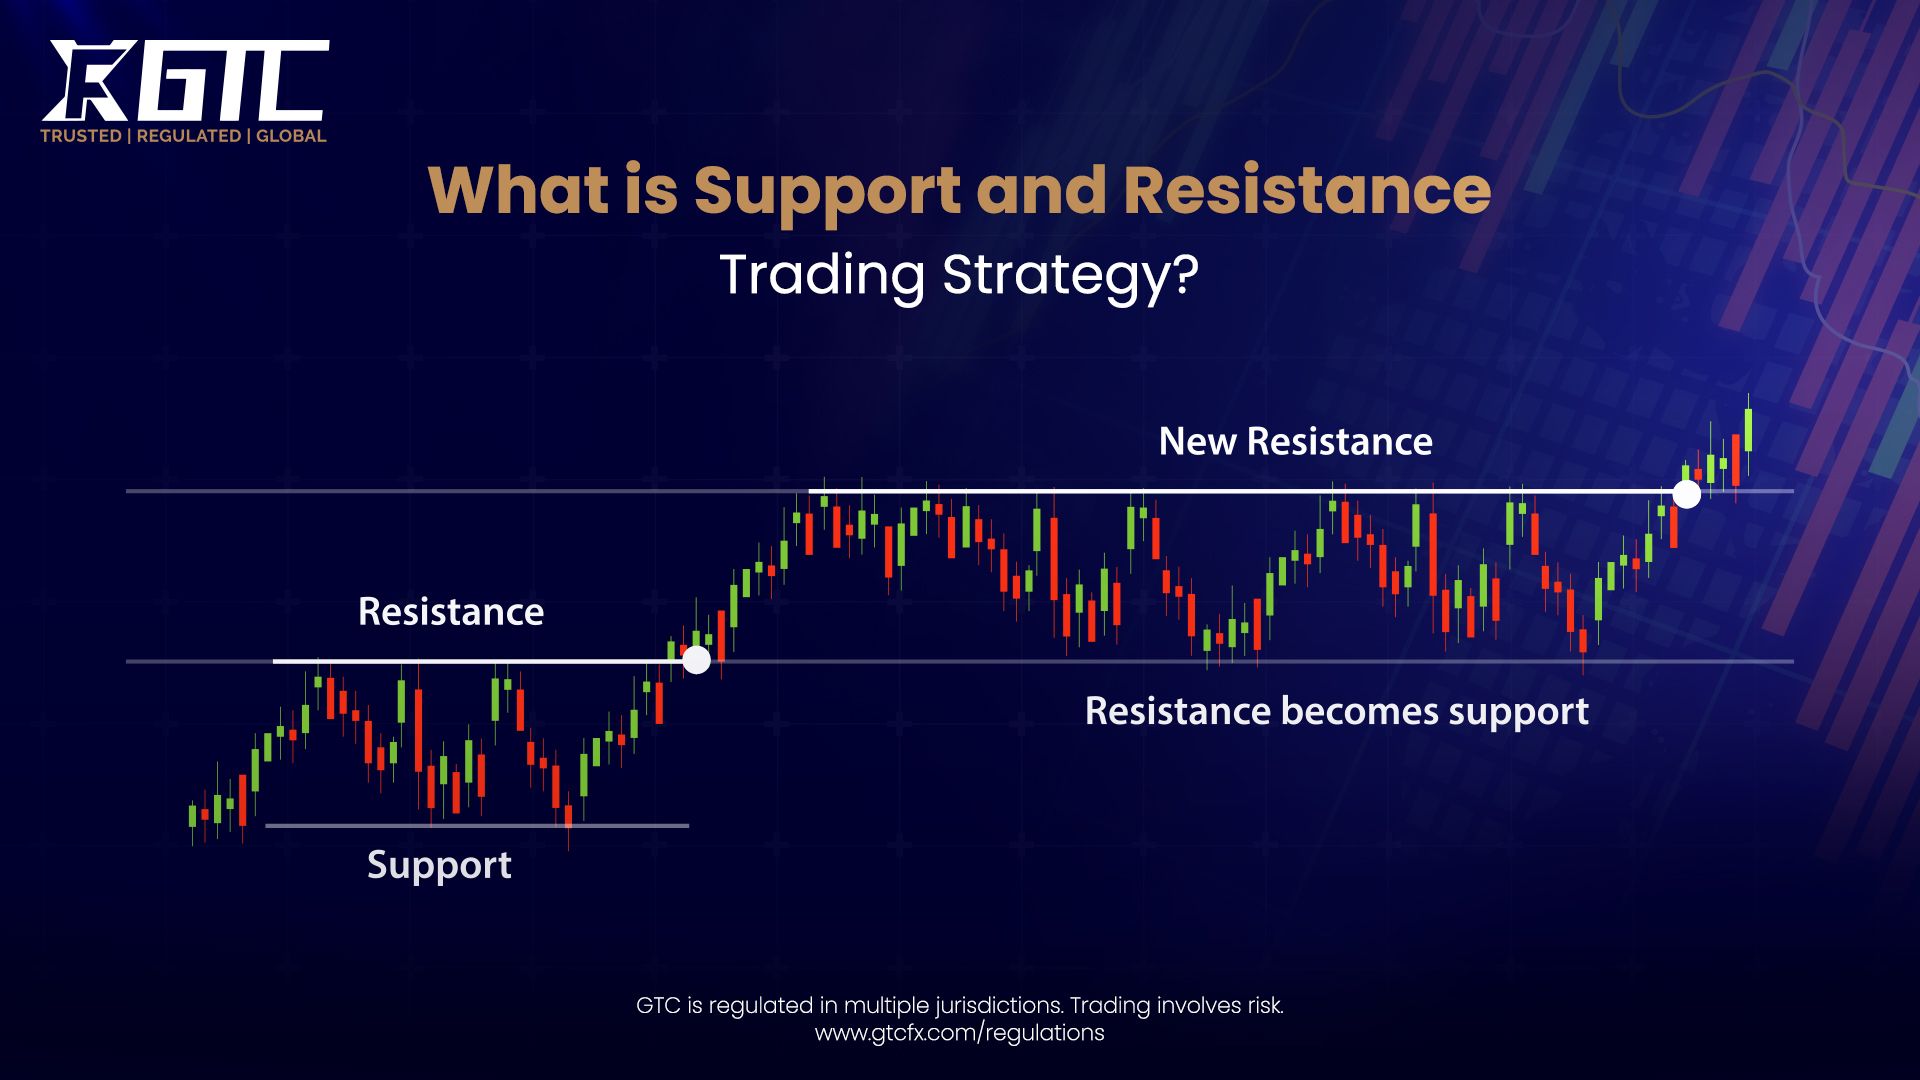
According to the research team of GTCFX, the Support and Resistance Trading Strategy represents one of the most foundational and powerful approaches in technical analysis forex and price action trading. This comprehensive strategy enables traders to identify critical price levels where market momentum tends to reverse or accelerate.
Support represents a price zone where buying interest prevents further decline, while resistance acts as a ceiling where selling pressure halts upward movement. The GTCFX team has extensively analyzed market structure trading support resistance patterns across multiple asset classes including stocks, forex, commodities, and cryptocurrencies. Understanding support and resistance levels for day trading provides traders with precise entry and exit points, effective risk management parameters, and enhanced profit potential through strategic position sizing.
The research conducted by the GTCFX expert team demonstrates that successful implementation of this strategy requires mastery of multiple components. These include horizontal support and resistance zones, dynamic support and resistance levels using moving averages, trendline support and resistance trading, pivot points support and resistance strategy, and support and resistance confluence zones.
Whether you're engaged in intraday support and resistance trading, swing trading support and resistance, or forex trading support resistance strategy, the principles remain consistent. The GTCFX research team emphasizes that proper identification of these levels combined with volume analysis and price action confirmation creates high-probability trading setups across all timeframes.
Support and resistance are critical technical analysis terms that are useful in several support and resistance strategies. Support refers to a price level where demand is concentrated enough to stop any further depreciation of prices. When prices approach this support, potential buyers start viewing the asset as a solid value thereby pushing for purchases, thereby creating a "floor" in the market.
Resistance, on the other hand, is around a price level where too much supply overwhelms any further demand for the rising prices. At these levels, sellers become active as they would see the asset as being over-valued, thereby dragging a ceiling for allowing the prices to be boosted.
These levels form with the help of the interplay between supply-demand dynamics and trader psychology. Meanwhile, the GTCFX team has observed that support and resistance regions are formed at price levels where significant historical order flow has taken place. Whenever prices return back, the actors get a vivid memory of the reactions to the levels, which consequently guide decision-making mechanisms.
This forms, in their turn, one of the true powerful self-fulfilling prophecies of trading as an order cluster around support and resistance levels that are visibly ruled by myriad bulletproof resistances made up or bought over to complement the support.
The support and resistance trading strategy is functional because it has a root in the collective psychology of the market. The GTCFX research team has found that these levels become psychological trap points at which important decisions are made by traders. With support, buyers feel they have a chance at entering into a better frame, but with resistance, sellers have chances to exit with profit or initiate short positions.
Participants in the market play their shot at the same levels of price, resulting in a very idle order flow. The orders (created through vested interest) put by many traders inside very strong support or resistance levels make those levels stronger. The GTCFX team firmly holds onto the view that understanding the psychology in it is the key to success in forex trading and must be closely watched along with other commodities trading, futures trading, stocks and bonds.
Horizontal support and resistance levels are static price levels that can simply be plotted using historical highs and lows. GTCFX research teams believe that horizontal levels are the simplest and widely used method that merely requires traders to link two or three price sections (areas) where either a reaction took place (reverse) alone; or vice versa.
For GTCFX's technical analysis explanation, horizontal levels are effective, as they mark price levels where significant supply or demand entered the market. For example, if a stock had bounced off the $50 mark three times over several months, it would establish this as a fortification. The key thing to take care of is having the touches encompass a span of time (otherwise, members believe there werenx96touching it consecutive within a short period)x95rather than having consecutive touching at a short period.
Best practices for horizontal support and resistance:
Dynamic support and resistance adapt to price movements, making them particularly effective in trending markets. The GTCFX team extensively researches moving average support and resistance levels as they provide flexible boundaries that adjust with market conditions. Common moving averages used include the 20-day EMA, 50-day SMA, and 200-day SMA.
Moving averages act as support in uptrends and resistance in downtrends. According to GTCFX research findings, when prices approach these moving averages, they often bounce, providing traders with dynamic support and resistance entry opportunities. The 200-day moving average particularly commands respect from institutional traders and often marks significant support or resistance.
Key characteristics of dynamic support and resistance:
Support and resistance trading using trendlines involves drawing diagonal lines connecting consecutive swing highs and lows. In an uptrend, the GTCFX experts recommend drawing the support trendline connecting higher lows. On the other hand, a downtrend is signaled by connecting lower highs creating the resistance trendline.
According to the Team of GTCFX research, sufficient trendlines are tested with a minimum of three or more touch points to confirm reliability. Additionally, the representation of how much it leans down or goes up provides the larger view of a trend, thereby identifying potential reversal so they can make a decision on either taking the order or exiting.
Pivot points support and resistance strategy uses mathematical calculations based on the high, low, and close of the previous period to project key levels for the current trading session. The GTCFX team uses many pivot point variations - Standard (Floor) Pivots, Camarilla Pivots, and Fibonacci Pivots.
Standard Pivot Point calculation:
Pivot Point (PP) = (High + Low + Close) / 3
Resistance 1 (R1) = (2 × PP) - Low
Resistance 2 (R2) = PP + (High - Low)
Support 1 (S1) = (2 × PP) - High
Support 2 (S2) = PP - (High - Low)
According to GTCFX research, pivot points work particularly well for intraday support and resistance trading as they provide predetermined levels before the market opens. Institutional traders and market makers often watch these levels, creating significant order flow concentrations.
The GTCFX expert team has developed a systematic approach to how to identify support and resistance levels effectively:
Step 1: Choose the right timeframe: For day trading, use 15-minute timeframes to 1-hour charts. For swing trading support and resistance, analyze daily and 4-hour timeframes. Higher timeframes provide more reliability in determining levels.
Step 2: Load enough historical data:GTCFX recommends 3-6 months of data for short-term levels and 12-18 months for long-term support and resistance levels. The longer the data you use, writing down the context for significant moving zones.
Step 3: Look for swing lows and swing highs:We are to point out the turning levels at respect to price change. Ignoring the minor ups and downs, you look for real starting points indicating a huge demand/supply.
Step 4: Proceed with horizontal lines establishing levels pulled in by the priceMore than three correct hits show a valid level of support or resistance. A key factor is the number of times the level has been tested successfully.
Step 5: Validate with volume analysis:Contrary to what GTCFX research shows, legitimate support and resistance levels normally show spikes in their trading volume once the markets arrive at them. Such changes in volume are what give the necessary mix of the critical market participants intervening at these levels.
The GTCFX research team emphasizes multiple timeframe analysis for robust support and resistance identification. Start with higher timeframes (daily or weekly) to identify major support and resistance levels. These represent institutional-level zones where large capital concentrations occur. Once major levels are established, drop to intermediate timeframes (4-hour or 1-hour) to refine entry timing. Finally, use lower timeframes (15-minute or 5-minute) for precise entry execution and stop loss placement. This layered approach ensures trades align with broader market structure while achieving optimal entry prices.
Support and resistance confluence zones represent areas where multiple support or resistance factors align at the same price level. According to GTCFX team research, confluence zones significantly increase the probability of price reactions compared to single-factor levels.
Common confluence factors include:
When two or more factors coincide, it indicates that different analytical methods all point to the same conclusion. The GTCFX experts emphasize that trading confluence of support resistance zones provides higher probability setups with better risk-reward ratios.
GTCFX research demonstrates that confluence zones work because they attract order flow from multiple trader groups. Technical analysts watching horizontal levels, trend followers monitoring trendlines, and algorithmic traders using pivot points all converge at these areas.
To effectively trade confluence zones:
Breakout trading with support and resistance involves entering positions when price violates established levels with conviction. The GTCFX team identifies this as a momentum-based approach that capitalizes on new trend development.
Valid breakout characteristics according to GTCFX research:
After a breakout, GTCFX experts recommend waiting for a retest of the broken level. A support turned resistance trading setup occurs when price breaks resistance, pulls back to test it as new support, and then continues higher. This retest provides a second entry opportunity with better risk-reward parameters.
Range trading support resistance strategies work best in consolidating markets where price oscillates between defined boundaries. The GTCFX research team utilizes this approach when markets lack a clear directional trend.
Range trading rules from GTCFX experts:
According to GTCFX analysis, markets spend approximately 70% of time in consolidation ranges. This makes range trading support resistance a highly practical strategy for consistent profits in sideways markets.
Price action support and resistance trading relies on candlestick patterns and raw price movement without additional indicators. The GTCFX expert team emphasizes this method for its simplicity and effectiveness across all market conditions.
Key price action signals at support and resistance:
GTCFX research indicates that combining price action confirmation with support and resistance levels significantly improves trade accuracy. Rather than blindly entering at levels, waiting for candlestick confirmation reduces false signals and increases winning percentage.
Swing trading support and resistance focuses on capturing multi-day or multi-week price swings between major levels. The GTCFX team recommends this approach for traders who cannot monitor markets constantly.
GTCFX swing trading framework:
Swing trading support and resistance requires patience but offers excellent risk-reward ratios as positions capture larger moves. The GTCFX research team has documented success rates improve when entries occur at major levels confirmed by multiple timeframes.
Intraday support and resistance trading involves identifying and trading key levels within a single trading session. GTCFX experts utilize several intraday-specific techniques:
Prior Day OHLC Method:Use previous day's open, high, low, and close as reference levels for the current session. These levels frequently act as intraday support and resistance due to psychological significance.
Opening Range Strategy:The first 30 minutes of trading establishes opening range high and low. Breakouts from this range often lead to directional moves, while oscillation within range provides bounce trading opportunities.
Pivot Points for Intraday:Calculate daily pivot points to identify predetermined intraday levels. Professional traders and institutions watch these levels, creating concentrated order flow.
VWAP (Volume Weighted Average Price):VWAP acts as dynamic intraday support and resistance, particularly effective for mean-reversion trading. Deviations from VWAP often revert to the mean, providing trading opportunities.
One of the most reliable patterns identified by GTCFX research is the support turned resistance trading setup. This phenomenon occurs because former support levels attract sellers once broken.
Why support becomes resistance:
GTCFX experts recommend waiting for a clean break of support, followed by pullback retest, before entering short positions. This provides optimal risk-reward as stops can be placed just above the former support turned resistance with targets at the next support level.
Market structure trading support resistance involves analyzing higher highs, higher lows (uptrend) or lower highs, lower lows (downtrend) in conjunction with key levels. The GTCFX team integrates market structure analysis to confirm trend direction. In uptrends, focus on support levels for long entries as price makes higher lows. In downtrends, focus on resistance levels for short entries as price makes lower highs. Trading against market structure significantly reduces success probability according to GTCFX research.
Forex liquidity matters significantly in support and resistance trading. The GTCFX research team has identified that forex liquidity distribution creates zones where large orders cluster, often coinciding with technical support and resistance levels.
Liquidity concepts for forex trading:
Understanding forex trading at institutional level reveals that banks and large funds hunt liquidity at key support and resistance levels. This explains sudden breakouts followed by reversals as liquidity is grabbed before true directional move.
When trading forex pairs, understanding base currency vs quote currency is essential for support and resistance analysis. The base currency (first in pair) is being bought or sold against the quote currency (second in pair). For example, in EUR/USD, EUR is base and USD is quoted. If EUR/USD hits resistance at 1.2000, it means 1 Euro costs 1.20 US Dollars, and sellers emerge at this level. GTCFX experts analyze support and resistance for each currency pair's unique characteristics.
Proper risk management requires understanding how to calculate pips and lots when trading support and resistance levels. A pip represents the smallest price movement in a currency pair, typically 0.0001 for most pairs or 0.01 for JPY pairs.
Lot size calculation formula from GTCFX:
Lot Size = (Account Balance × Risk %) / (Stop Loss in Pips × Pip Value)
For example, with $10,000 account, risking 2%, stop loss 50 pips from support level, and $10 pip value:
Lot Size = ($10,000 × 0.02) / (50 × $10) = 0.4 lots
This ensures consistent risk management regardless of where support and resistance levels place your stops.
Leverage in forex trading amplifies both potential profits and losses when trading support and resistance strategies. The GTCFX research team emphasizes that leverage must be managed carefully, especially when trading breakouts or bounces from key levels.
In India, SEBI allows 1:50 leverage for major pairs and 1:20 for minor pairs. While leverage enables controlling larger positions, the GTCFX team recommends:
Price action trading forms the foundation of effective support and resistance strategies. Unlike indicator-based approaches, price action focuses on actual price movements and formations.
GTCFX experts combine price action trading with support and resistance for confirmation:
While support and resistance rely on technical analysis forex, fundamental analysis forex provides context for understanding why levels break or hold. The GTCFX research team recommends monitoring economic calendars for major data releases. Strong fundamental catalysts can override technical levels. For example, central bank interest rate decisions often break through established support and resistance as fundamental outlook shifts dramatically. Integrating both analyses provides a comprehensive trading edge.
According to GTCFX research analysis, EUR/USD established resistance at the 1.1200 level with four touches over three weeks. Volume declined on each approach, indicating weakening selling pressure. When the ECB announced an accommodative policy shift, EUR/USD broke 1.1200 with 200% normal volume.
Trade execution per GTCFX strategy:
Entry: 1.1220 on daily close above resistance
Stop loss: 1.1180 below broken resistance (40 pips)
Target: 1.1400 at next resistance confluence zone (180 pips)
Risk-reward ratio: 1:4.5
Price retraced to 1.1205, testing broken resistance as new support before rallying to 1.1380. This support turned resistance trading setup provided a second entry opportunity with even better risk-reward.
GTCFX intraday research on the Indian stock market showed Nifty 50 trading in the 18,400-18,550 range during the consolidation phase. Using pivot points support and resistance strategy combined with opening range, traders identified clear boundaries.
Intraday trading plan:
Buy at support: 18,400-18,410 zone with RSI oversold confirmation
Sell at resistance: 18,540-18,550 zone with RSI overbought confirmation
Stop loss: 50 points beyond range boundaries
Profit target: Opposite end of range (140-150 points)
This range trading support resistance approach yielded 4 profitable trades over 5 days before eventual breakout. GTCFX data shows range strategies maintain high win rates during consolidation periods.
According to GTCFX research team, support and resistance trading strategy offers numerous compelling advantages:
The GTCFX expert team also identifies important limitations:
Expert Tip 1: Always Confirm with Volume
GTCFX lead analyst emphasizes that volume confirmation separates legitimate support and resistance reactions from noise. When price bounces from support or breaks through resistance, observe volume profile. Genuine moves show 50-150% above-average volume. Low volume reactions typically fail as they lack conviction. Use volume as final confirmation filter before trade execution.
Expert Tip 2: Zone Thinking Over Line Thinking
Senior GTCFX traders recommend treating support and resistance as zones rather than exact price lines. Markets don't reverse at precise levels but within price areas. Draw zones incorporating candlestick wicks and bodies rather than single lines. This accommodates normal price fluctuation and prevents premature stop-outs from minor level violations. Zone width typically ranges 20-50 pips for forex pairs depending on volatility.
Expert Tip 3: Align with Higher Timeframes
GTCFX technical director advises always checking higher timeframe support and resistance before entering trades on lower timeframes. Daily and weekly levels override intraday levels in importance. Attempting to trade against major higher timeframe resistance on 15-minute charts leads to losses. Start analysis on daily charts, identify key levels, then drop to execution timeframe for entry timing. This multi-timeframe approach dramatically improves winning percentage.
Opinion 1: Institutional Perspective
"Support and resistance levels represent more than just technical chart patterns; they mark where institutional order flow concentrates. At major banks and hedge funds, we place accumulation orders at support zones and distribution orders at resistance zones. Retail traders who understand this institutional behavior gain a significant edge. The key is identifying levels where liquidity pools exist and positioning ahead of the move." - GTCFX Senior Market Analyst
Opinion 2: Price Action Integration
"After analyzing thousands of trades, I've concluded that pure support and resistance without price action confirmation produces mediocre results. The magic happens when candlestick patterns form at key levels. A pin bar rejection at support confirmed by volume spike provides far higher probability setup than simply buying because price reached support. Integration of price action transforms support and resistance from good strategy to exceptional strategy." - GTCFX Lead Trading Strategist
Opinion 3: Adaptive Approach Required
"Markets evolve, and so must our support and resistance analysis. Levels that worked in 2023 may not work in 2025 due to changed market structure, volatility regimes, and participant behavior. Successful traders continuously adapt their level identification methods, confirmation criteria, and risk parameters. Don't treat support and resistance as a static system but as a dynamic framework requiring regular refinement based on current market characteristics." - GTCFX Director of Research
According to the GTCFX research and expert team, this comprehensive guide delivers exceptional value to traders at all experience levels. The content synthesizes years of institutional trading experience with academic research to provide actionable knowledge applicable immediately in live markets.
For beginners, this blog establishes a foundation understanding of how markets function at a fundamental level. Learning that prices move between support and resistance zones provides a mental model for interpreting market behavior. New traders gain specific identification techniques, entry rules, and risk management protocols that create structure in otherwise chaotic markets.
Intermediate traders benefit from advanced concepts like confluence zones, support turned resistance setups, and multi-timeframe analysis. These refinements elevate basic support and resistance knowledge to professional-grade strategy implementation. Integration with concepts like forex liquidity distribution, price action patterns, and volume confirmation transforms simple concepts into sophisticated trading systems.
Professional traders appreciate institutional perspective on how large players use support and resistance levels. Understanding that banks accumulate at support and distribute at resistance reveals the invisible hand moving markets. This knowledge enables position alongside rather than against institutional capital flows.
The blog's comprehensive coverage across multiple asset classes stocks, forex, commodities, and cryptocurrencies means concepts translate directly to readers' preferred markets. Whether trading Nifty 50 options, EUR/USD forex, or Bitcoin futures, the principles remain consistent. This universality provides a remarkable return on learning investment.
Integration with complementary topics like leverage in forex trading, how to calculate pips and lots, fundamental analysis forex, and technical analysis forex creates holistic trading education. The GTCFX team designed this guide as a standalone resource requiring no additional materials to implement successfully.
Practical examples, detailed tables, and real trade scenarios ground theoretical concepts in reality. Readers can visualize exact implementation rather than struggling with abstract ideas. The inclusion of pros and cons demonstrates a balanced perspective acknowledging both strengths and limitations.
Most importantly, the content comes from the GTCFX team's proven track record of successful trading across institutional and retail environments. This isn't academic theory but battle-tested methodology refined through millions of dollars in live trading. Users gain access to professional-grade knowledge typically available only within proprietary trading firms or expensive mentorship programs.
The Support and Resistance Trading Strategy represents the bedrock of technical analysis across all financial markets. According to the GTCFX blog team's extensive research, mastering this approach provides traders with a reliable framework for identifying high-probability entry and exit points while managing risk effectively.
Throughout this comprehensive guide, we've explored multiple dimensions of support and resistance including horizontal and dynamic levels, trendline analysis, pivot point calculations, and confluence zone identification. The GTCFX research team has demonstrated how breakout trading with support and resistance, range trading strategies, and support turned resistance setups work across different market conditions.
Integration with broader forex concepts like understanding base currency vs quote currency, calculating pips and lots for position sizing, and managing leverage in forex trading creates holistic trading education. The combination of price action support and resistance trading with fundamental analysis forex provides an edge that purely technical or purely fundamental approaches cannot achieve alone.
Whether implementing intraday support and resistance trading for scalping, swing trading support and resistance for multi-day positions, or position trading using weekly levels, the core principles remain consistent. Stock market support resistance levels function identically to forex trading support resistance strategy, demonstrating universal applicability.
The GTCFX expert team emphasizes that successful implementation requires patience, discipline, and continuous learning. Support and resistance analysis must adapt as markets evolve. What worked in previous years may require adjustment for current market structure. Traders who treat this as a living methodology rather than a static system achieve long-term consistency.
This guide provides the knowledge foundation, but skill develops through practice. GTCFX recommends starting with demo accounts, thoroughly testing identification methods, and building confidence before risking significant capital. Document trades, analyze mistakes, and refine approach iteratively. Professional traders aren't born, they're developed through dedicated practice applying proven methodologies like support and resistance trading strategy.
Q1: What is the most reliable method to identify support and resistance levels?
The most reliable method is combining multiple techniques. Use horizontal levels with at least three well-spaced touches, confirm with volume, moving averages, and confluence with Fibonacci or pivot points for higher accuracy.
Q2: How do I know when support or resistance will break versus hold?
A level weakens with repeated tests, declining volume near resistance, tight consolidation, strong trend direction, or major news events. Always wait for a strong candle close beyond the level with increased volume.
Q3: Should I use exact lines or zones when drawing support and resistance?
Zones are more effective than exact lines. Price reacts within areas due to market volatility and order flow. Using zones helps avoid false breakouts and premature stop losses.
Q4: Can support and resistance trading work for both intraday and swing trading?
Yes, support and resistance work across all timeframes. Intraday traders focus on short-term levels like pivot points, while swing traders use daily and weekly levels. The concept remains the same.
Q5: How do I manage risk when trading support and resistance strategies?
Place stop loss beyond the level, risk only 1–2% per trade, adjust position size based on volatility, avoid high leverage, and book partial profits near targets to protect gains.
Add as a preferred source on Google
Learn when the forex market opens and closes, how Sydney, Tokyo, London and New York sessions work, and how overlaps, DST and holidays affect trading activity.
SEP 18, 2026

In forex trading, timing can make the difference between a smart entry and a costly mistake. But with prices moving constantly, how can traders spot meaningful…
SEP 18, 2026

Explore the strongest currencies in 2026 by nominal value, including the Kuwaiti dinar, Bahraini dinar, Omani rial, Jordanian dinar and British pound, plus the…
SEP 17, 2026
-Open Your Account in Minutes-
Get instant access to global markets, advanced charting, and expert insights. Whether you're a beginner or a professional, your next opportunity starts here. Secure, regulated, and transparent.
