

How to Make a Forex Withdrawal on GTC Go (GTCFX Guide)?
GTC Go is GTCFX's mobile trading app, giving traders quick access to accounts, markets, and fund management. As a regulated forex broker, GTCFX aims to make ev…
OCT 15, 2026
00
Blogs
Last updated: august 13, 2026 at 12:53 pm
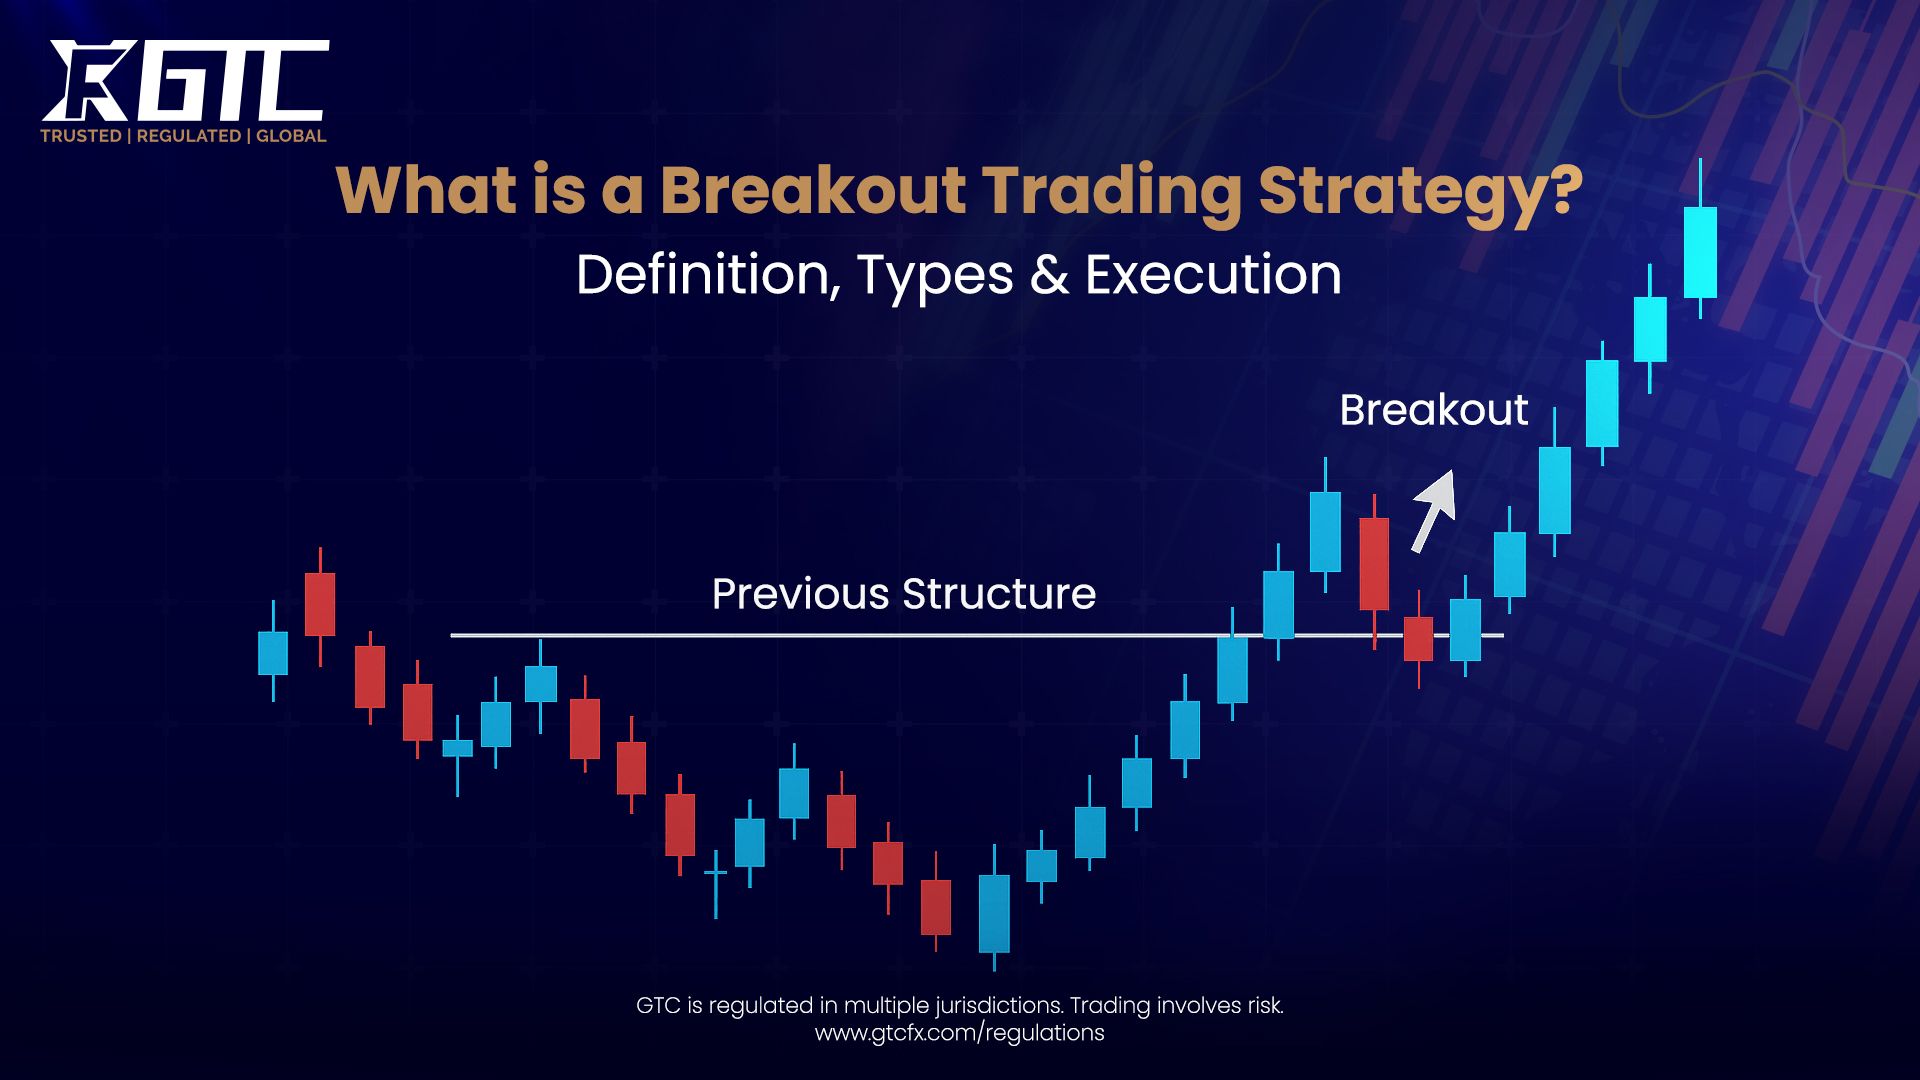
A breakout trading strategy is a method where a trader enters a position after the price of an asset moves outside a defined price range. This movement usually occurs when the price breaches a specific level of support or resistance with increased volume.
Traders use this strategy to capitalize on the volatile move that often follows the breach of these key levels. Learning what is forex trading for beginners can help you understand the basics behind these movements.
The core philosophy behind this strategy is that price consolidations represent a battle between buyers and sellers. When one side wins, the price tends to trend strongly in that direction.
Understanding why forex liquidity matters and how to measure it can further enhance your ability to spot valid breakouts and ride momentum for significant profits. For more insights, you can explore resources directly at GTCFX.
Key characteristics of a breakout include:
Breakouts work because they represent a shift in market sentiment and supply-demand dynamics. During a consolidation phase, the market is in equilibrium, meaning buyers and sellers agree on the price. A breakout signals that this equilibrium has been shattered.
When resistance breaks, sellers who placed stop-losses above that level are forced to buy back their positions to cover losses. Simultaneously, breakout traders enter new long positions, creating a surge of buying pressure. This double-engine of buying fuels the rapid price increase.
The psychological triggers include:
Breakout strategies are generally categorized by the market environment in which they occur. Understanding the context is crucial for selecting the right approach and managing risk effectively.
A continuation breakout occurs within the context of an existing trend. The market pauses to "catch its breath" after a strong move, forming a consolidation pattern. Once the consolidation ends, the price breaks out in the same direction as the prior trend.
These are often considered high-probability trades because you are trading with the prevailing momentum. The underlying trend acts as a wind at your back, pushing the trade forward.
Common patterns associated with continuation:
A reversal breakout signals a potential change in the overall trend direction. These occur after a prolonged trend when the price loses momentum and begins to move against the dominant direction. Reversal breakouts are powerful but can be riskier than continuation plays.
Traders looking for reversals are essentially betting that the current trend is exhausted. Successful execution here often catches the very beginning of a new, long-term trend.
Common patterns associated with reversals:
Recognizing specific geometric shapes on a chart is the bread and butter of a breakout trader. These patterns represent different psychological states of the market participants.
This pattern forms when the market is making lower highs and higher lows. It represents a period of indecision where neither buyers nor sellers are in control. As the price apex tightens, volatility contracts.
This is a bullish pattern characterized by a flat resistance level and a rising support trendline. It indicates that buyers are becoming more aggressive, stepping in at higher prices each time.
The inverse of the ascending triangle, this is a bearish pattern. It features a flat support level and a falling resistance trendline. Sellers are getting more aggressive, pushing the price down earlier each time.
This is a famous bullish continuation pattern that resembles a tea cup. The "cup" is a U-shaped recovery, and the "handle" is a short pullback or consolidation.
Volume is the fuel that powers the breakout vehicle. Without significant volume, a breakout is likely to fail and revert back into the range. You should treat volume as a lie detector test for price action.
Analyzing volume during breakouts:
A false breakout occurs when price moves past a level but fails to hold it, snapping back into the original range. This is the biggest risk for breakout traders. It traps aggressive traders who enter too early.
Strategies to minimize fakeouts:
Breakout trading is fractal, meaning it works on all timeframes. However, the reliability and potential profit vary depending on your chosen horizon.
Intraday (Day Trading):
Swing Trading:
Now that we understand the definitions and types, let’s look at the execution. A disciplined process is required to turn theory into profit. You must have a rigid set of rules for entry, stop loss, and take profit.
Step 1: Identify the Market Condition
Before looking for a specific pattern, analyze the broader market context. Is the overall market trending up, down, or moving sideways?
Step 2: Draw Your Levels Clearly
Accurate support and resistance lines are the foundation of this strategy. Do not force a line to fit the chart; let the chart dictate the line.
Step 3: Waiting for the Setup (The Squeeze)
The best breakouts occur after a period of low volatility, known as a "squeeze." This is where the price range narrows significantly.
Step 4: The Entry Trigger
There are two main schools of thought on when to enter the trade.
Step 5: Placing the Stop Loss
Risk management is non-negotiable. Your stop loss protects your capital if the breakout fails.
Step 6: Setting the Profit Target
You should have a clear exit plan before you enter the trade.
While price and volume are king, indicators can provide a secondary layer of confirmation. These tools help you gauge the internal strength of the market.
Bollinger Bands are excellent for visualizing volatility.
RSI measures the speed and change of price movements.
Moving averages help smooth out price data to confirm the trend direction.
OBV is a cumulative indicator that adds volume on up days and subtracts it on down days.
Even experienced traders fall victim to common pitfalls. Being aware of these errors is the first step to avoiding them.
Success in trading is often 20% strategy and 80% psychology. Breakout trading requires a specific mindset.
Patience vs. Impulsiveness
You must have the patience of a sniper, waiting hours or days for the perfect setup. However, when the signal triggers, you must act without hesitation. This "hurry up and wait" dynamic is difficult for many to master.
Dealing with False Breakouts
False breakouts are psychologically damaging. They can make you hesitant to take the next valid signal (gun shy). You must accept that losses are the "cost of doing business" and not a reflection of your intelligence.
The Fear of Heights
Buying a stock at a 52-week high feels unnatural to human nature. We are wired to "buy low." Breakout traders must retrain their brains to "buy high and sell higher."
To ensure your trading adheres to high standards of trustworthiness, you must rely on authoritative sources and regulated market data. Trading involves significant financial risk.
Reliable Resources:
While the mechanics are identical, the direction differs.
Key nuance:
Markets tend to fall faster than they rise due to fear being a stronger emotion than greed. Therefore, breakdowns often happen more violently and require faster reaction times than breakouts.
In the age of AI and algorithmic trading, breakouts are a popular strategy for automation.
Breakout trading is one of the most explosive ways to grow a trading account. It aligns you with the most powerful force in the market: momentum. However, it is not a "get rich quick" scheme.
It requires the ability to identify valid patterns, the patience to wait for confirmation, and the discipline to cut losses when a breakout fails. By focusing on high-quality setups with volume confirmation and favorable market context, you can tilt the odds in your favor. Learning about base vs quote currency and leverage in forex trading can further improve your understanding of market dynamics. Additionally, mastering concepts like forex pips and lots and risk management will help you execute breakout trades more effectively.
Start by practicing on a simulator. Identify the patterns discussed here triangles, flags, and ranges. Once you can spot them in real-time and execute with discipline, you will be well on your way to mastering the art of the breakout.
Q1: What is the best timeframe for breakout trading?
The "best" timeframe depends on your personality and capital. The Daily chart is generally considered the most reliable for significant moves. However, day traders often find success on the 15-minute chart.
Q2: How do I know if a breakout is real?
You can never be 100% sure, but volume is your best clue. Real breakouts are almost always accompanied by a surge in volume (relative volume > 150%). A closing candle outside the range is also a strong confirmation.
Q3: What assets work best for breakout trading?
This strategy works on any asset with high liquidity and volatility. Crypto and Tech Stocks are famous for explosive breakouts. Forex pairs can also break out, but they tend to have more "fakeouts" due to the mean-reverting nature of currencies.
Add as a preferred source on Google
GTC Go is GTCFX's mobile trading app, giving traders quick access to accounts, markets, and fund management. As a regulated forex broker, GTCFX aims to make ev…
OCT 15, 2026
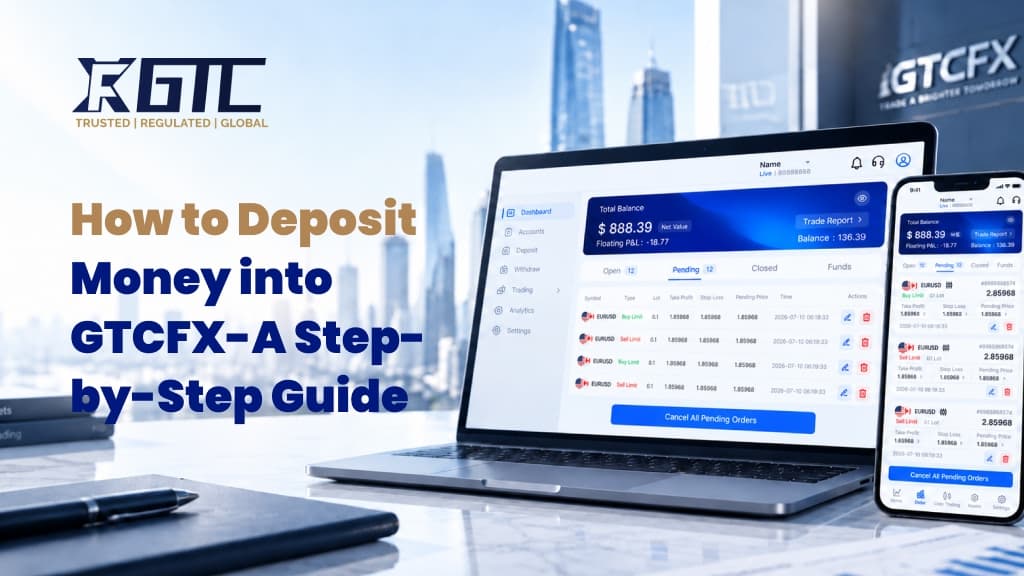
Depositing funds into your trading account is an essential step before you start trading with GTCFX. This guide explains how to deposit money into GTCFX, inclu…
OCT 14, 2026

Learn when the forex market opens and closes, how Sydney, Tokyo, London and New York sessions work, and how overlaps, DST and holidays affect trading activity.
SEP 18, 2026
-Open Your Account in Minutes-
Get instant access to global markets, advanced charting, and expert insights. Whether you're a beginner or a professional, your next opportunity starts here. Secure, regulated, and transparent.
