

When Does Forex Market Open? (2026 Update)
Learn when the forex market opens and closes, how Sydney, Tokyo, London and New York sessions work, and how overlaps, DST and holidays affect trading activity.
SEP 18, 2026
00
Blogs
Last updated: august 13, 2026 at 12:53 pm
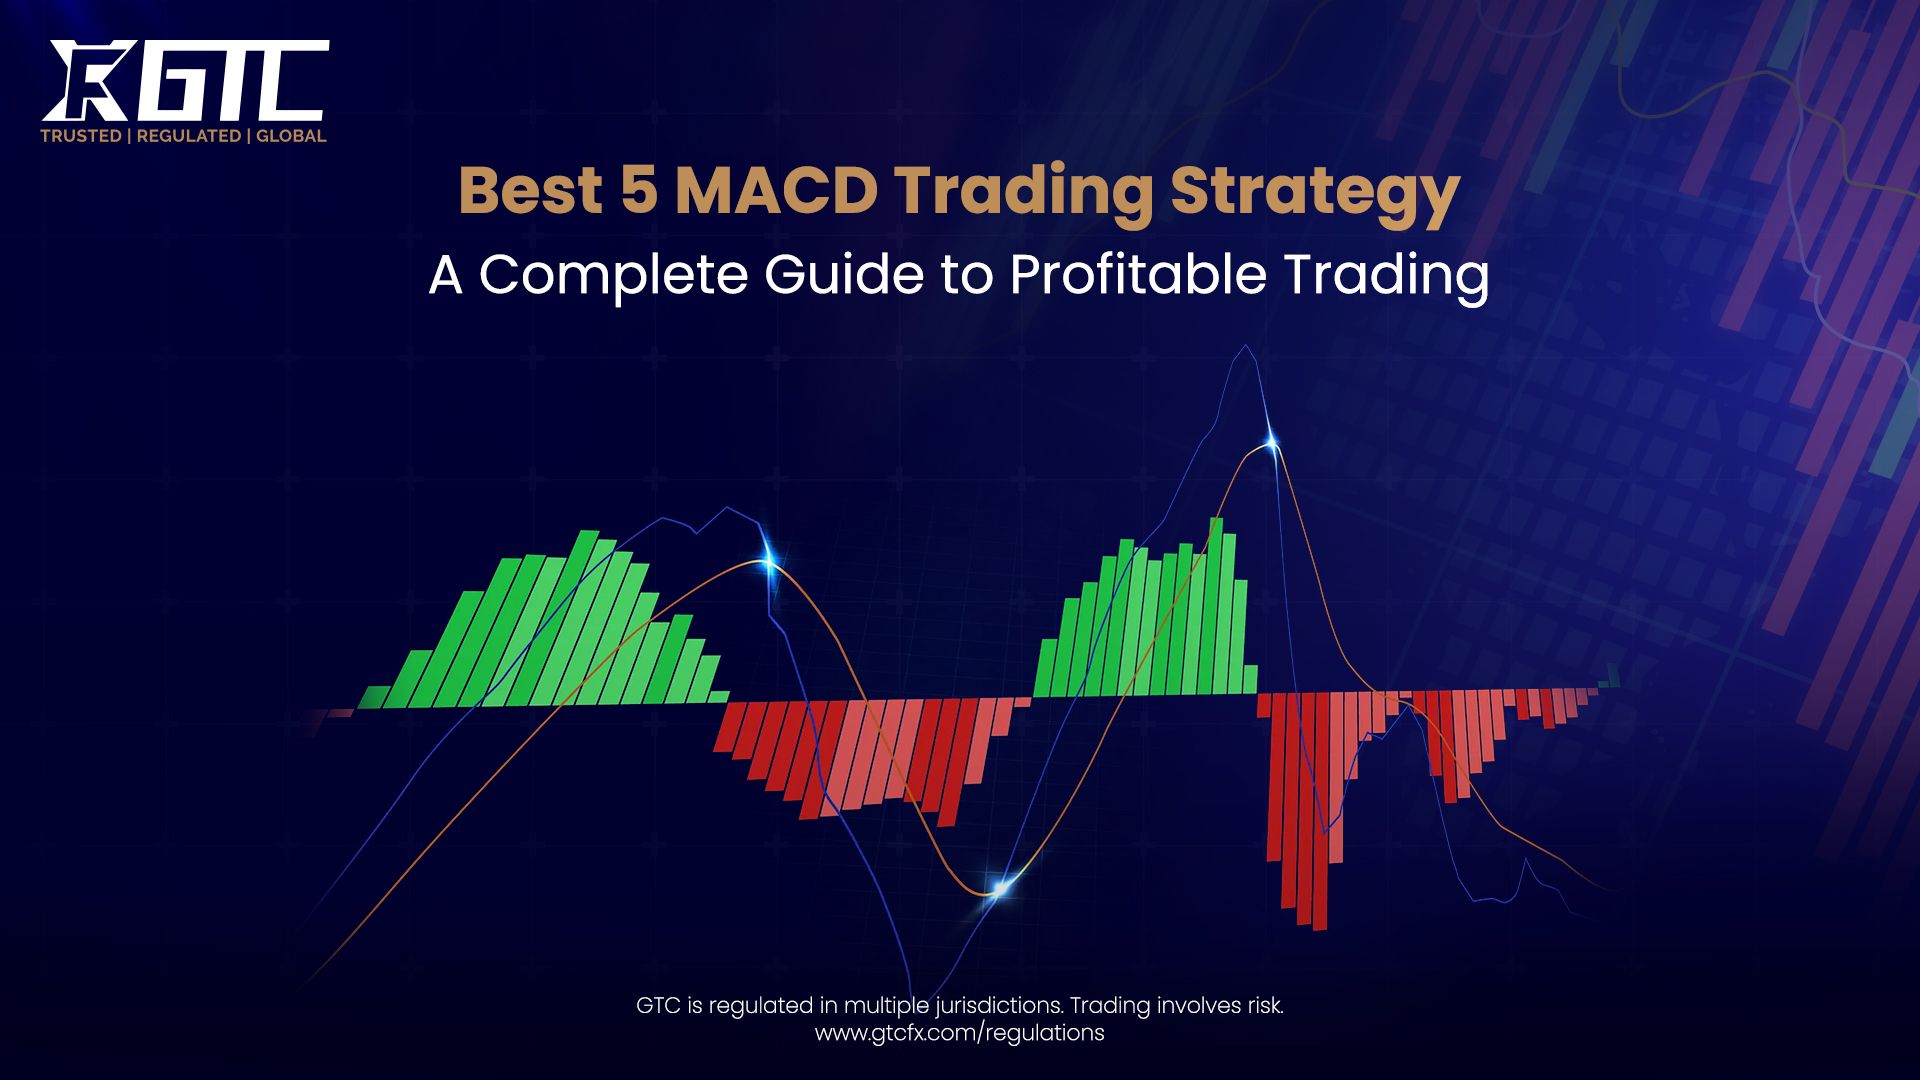
Mastering MACD can boost your trading profits. In this guide, we cover the best 5 MACD strategies for smarter trades. Learn the basics of forex trading and why liquidity matters with insights from GTCFX.
The Moving Average Convergence Divergence (MACD) indicator stands as one of the most powerful tools in a trader's arsenal. This momentum-based indicator helps traders identify trend direction, momentum shifts, and optimal entry-exit points across all markets.
MACD trading strategy has revolutionized how modern traders approach technical analysis. Whether you're trading stocks, forex, or cryptocurrencies, mastering the MACD indicator provides a competitive edge in identifying high-probability trades.
The beauty of MACD trading strategy lies in its versatility and simplicity. Professional traders worldwide rely on various MACD trading strategies to generate consistent profits. In this comprehensive guide, we'll explore the five most effective MACD trading strategies that can transform your trading performance.
The MACD crossover strategy ranks among the most popular MACD trading strategies used by professional traders globally. This strategy is straightforward yet highly effective for identifying momentum shifts and trend reversals.
A bullish MACD crossover occurs when the MACD line crosses above the signal line. This indicates that buying pressure is increasing and selling pressure is fading. Traders interpret this as a potential entry point for long positions, as the market momentum is shifting upward.
Conversely, a bearish MACD crossover happens when the MACD line crosses below the signal line. This signals that selling pressure is increasing and a downtrend may be forming. Traders often use this as an exit signal for long positions or an entry point for short trades.
Step 1: Identify the Crossover Point
Watch for the MACD line to cross above or below the signal line. The histogram bars will flip from negative to positive (bullish) or positive to negative (bearish).
Step 2: Confirm with Trend Context
Verify that the crossover aligns with the overall market trend. Check if price action supports the MACD signal through higher highs, lower lows, or breakouts above resistance levels.
Step 3: Set Entry Points
Step 4: Place Stop Loss and Take Profit
Set stop-loss orders beyond nearby swing points for protection. Take profit near support or resistance levels, or exit when the MACD crosses back in the opposite direction.
Why MACD Crossovers Work
The MACD crossover strategy works because it captures momentum shifts early. When the faster-moving average (12-period) overtakes the slower one (26-period), it indicates genuine momentum acceleration, not just temporary price fluctuations.
Many professional traders combine MACD crossovers with volume analysis to confirm signals. Increasing volume during a bullish MACD crossover strengthens the probability of continued upward movement.
The MACD zero line serves as a critical boundary between bullish and bearish momentum. This line represents the equilibrium point where the 12-period EMA equals the 26-period EMA.
The MACD zero line strategy focuses on whether the MACD line is trading above or below this neutral level. This provides valuable insights into the market's underlying momentum condition and confirms broader trend direction.
When MACD is above the zero line, it indicates the fast-moving average is stronger than the slow-moving average. This reflects bullish momentum and suggests an uptrend is established.
When MACD is below the zero line, it indicates the slow-moving average has overtaken the fast-moving average. This reflects bearish momentum and suggests a downtrend is underway.
Bullish Zero Line Crossover Signal
The most powerful MACD trading strategy using the zero line occurs when the MACD line crosses above the zero line. This signals that bullish momentum is taking control.
Bearish Zero Line Crossover Signal
Conversely, when the MACD line crosses below the zero line, it signals that bearish momentum is gaining strength.
Why Zero Line Strategy Generates Fewer False Signals
The zero line strategy produces fewer false signals compared to signal line crossovers. Since crossing the zero line requires more substantial momentum shifts, it filters out the whipsaws and head fakes that plague many traders using only crossover signals.
Professional traders often use the zero line as a "bias" indicator. When MACD is above zero, they only take long trades. When MACD is below zero, they only consider short opportunities. This discipline significantly improves win rates.
MACD divergence represents one of the most powerful reversal signals in technical analysis. Divergence occurs when price moves in one direction while the MACD indicator moves in the opposite direction.
This discrepancy signals that momentum is weakening, even though price may still be making higher or lower extremes. It's one of the best early warning systems for potential trend reversals.
1. Bullish Divergence (Regular)
A regular bullish divergence forms when price makes a lower low, but the MACD line makes a higher low. This indicates:
The bullish divergence MACD strategy is highly effective for identifying potential buying opportunities near market bottoms and support levels.
2. Bearish Divergence (Regular)
A regular bearish divergence occurs when price makes a higher high, but the MACD line makes a lower high. This signals:
Professional traders use bearish divergence to exit long positions before significant pullbacks or to initiate short positions.
Step 1: Identify Two Peaks or Valleys
Look for two distinct peaks (for bearish divergence) or two valleys (for bullish divergence) in both price and MACD.
Step 2: Confirm the Divergence Pattern
Step 3: Wait for Confirmation Signals
Don't trade divergence in isolation. Wait for additional confirmation through candlestick patterns, support/resistance breaks, or RSI signals.
Step 4: Enter at Reversals
Beyond regular divergence, professional traders also identify hidden divergence patterns. Hidden divergence indicates that the existing trend will pause before continuing in the same direction.
A hidden bullish divergence forms when MACD makes lower lows while price makes higher lows. This suggests uptrend continuation after a pullback.
A hidden bearish divergence occurs when MACD makes higher highs while price makes lower highs. This indicates downtrend continuation after a relief rally.
The simplest MACD histogram strategy involves following expanding bars. When histogram bars grow larger, momentum is accelerating. This provides excellent opportunities to add to winning positions or enter early in strong trends.
More advanced traders use histogram reversals to identify potential trend changes. When histogram bars begin shrinking or flipping direction, momentum is shifting.
The most effective MACD histogram strategy combines it with price action analysis:
Professional traders don't rely on a single indicator. The MACD + RSI combination strategy creates a powerful two-indicator system that filters false signals and improves win rates dramatically.
MACD identifies trend direction and momentum shifts, while the Relative Strength Index (RSI) identifies overbought/oversold conditions. Together, they provide complementary insights that significantly enhance trading accuracy.
1. Bullish Entry Confirmation
The strongest bullish signal occurs when multiple confirmations align:
When all four conditions align, the probability of a successful trade increases substantially. This is why professional traders combine these indicators—filtering out 60-80% of false signals.
2. Bearish Entry Confirmation
The strongest bearish signal occurs when:
An advanced technique combines divergence analysis with both indicators:
Before diving into the best 5 MACD trading strategy, it's crucial to understand what MACD is and how it works.
The MACD indicator consists of three main components:
How MACD Indicator Works
The MACD indicator measures the relationship between two moving averages. When short-term momentum (12-period EMA) is stronger than long-term momentum (26-period EMA), the MACD line moves above zero, signaling bullish conditions. Conversely, when long-term momentum dominates, the MACD moves below zero, indicating bearish pressure.
The standard MACD settings are (12, 26, 9), which work effectively across multiple timeframes. However, traders can customize these settings based on their trading style and market conditions.
The default settings (Fast: 12, Slow: 26, Signal: 9) work well for most traders across multiple timeframes. These settings provide a good balance between early signals and false signal reduction.
Professional traders like Linda Raschke use faster MACD settings for day trading and scalping. The settings (Fast: 3, Slow: 10, Signal: 16) detect signals much earlier, ideal for:
However, faster settings generate more signals and more false signals, requiring strict confirmation filters.
Conservative swing traders often use slower settings for reducing noise:
Setup: 4-hour chart of a major forex pair.
Entry: Buy at next candle close with 2% stop loss.
Target: Nearest resistance or 1:2 risk-reward ratio.
Setup: Daily stock chart near resistance.
Entry: Short position if price breaks below support.
Target: Previous support level or recent swing low.
The MACD indicator provides multiple powerful trading strategies that can transform your trading results. From the popular crossover strategy to the sophisticated divergence techniques, MACD offers something for every trading style.
The key to success with MACD trading strategy is combining multiple confirmation signals. Never rely on MACD alone. Combine it with price action, volume analysis, RSI, and proper risk management for consistently profitable trading.
Start with the basic MACD crossover strategy to build confidence, then gradually incorporate more advanced techniques like divergence and histogram analysis. As you gain experience, you'll develop your own version of the best MACD trading strategy tailored to your specific market and timeframe.
Remember that technical analysis should always be combined with fundamental analysis and sound money management principles. The MACD indicator is a tool—not a crystal ball. Use it wisely alongside other analysis methods for maximum trading success.
1. What is the MACD trading strategy?
The MACD (Moving Average Convergence Divergence) strategy uses trend-following and momentum indicators to identify potential buy or sell signals in the market.
2. What are the 5 best MACD trading strategies?
The top strategies include: MACD Crossover, MACD Divergence, MACD Histogram Analysis, MACD with RSI confirmation, and MACD Trend Following.
3. Can beginners use MACD for trading?
Yes, beginners can start with the MACD crossover strategy to understand trend changes before moving on to more advanced techniques like divergence or histogram analysis.
4. Should I rely on MACD alone?
No. For consistently profitable trades, MACD should be combined with other tools like price action, volume, RSI, and proper risk management.
5. Is MACD suitable for all markets and timeframes?
Yes, MACD works across forex, stocks, and crypto markets and can be applied on multiple timeframes, but strategy adjustment may be required for optimal results.
Add as a preferred source on Google
Learn when the forex market opens and closes, how Sydney, Tokyo, London and New York sessions work, and how overlaps, DST and holidays affect trading activity.
SEP 18, 2026

In forex trading, timing can make the difference between a smart entry and a costly mistake. But with prices moving constantly, how can traders spot meaningful…
SEP 18, 2026

Explore the strongest currencies in 2026 by nominal value, including the Kuwaiti dinar, Bahraini dinar, Omani rial, Jordanian dinar and British pound, plus the…
SEP 17, 2026
-Open Your Account in Minutes-
Get instant access to global markets, advanced charting, and expert insights. Whether you're a beginner or a professional, your next opportunity starts here. Secure, regulated, and transparent.
