Los CFD son instrumentos apalancados altamente especulativos. Operar con CFD conlleva un alto grado de riesgo para tu capital. Los inversores deben asegurarse de contar con conocimientos adecuados del mercado o buscar asesoramiento financiero independiente antes de realizar operaciones.

Volver a Blogs
TRADING TOOLS GUIDEReading the market with data

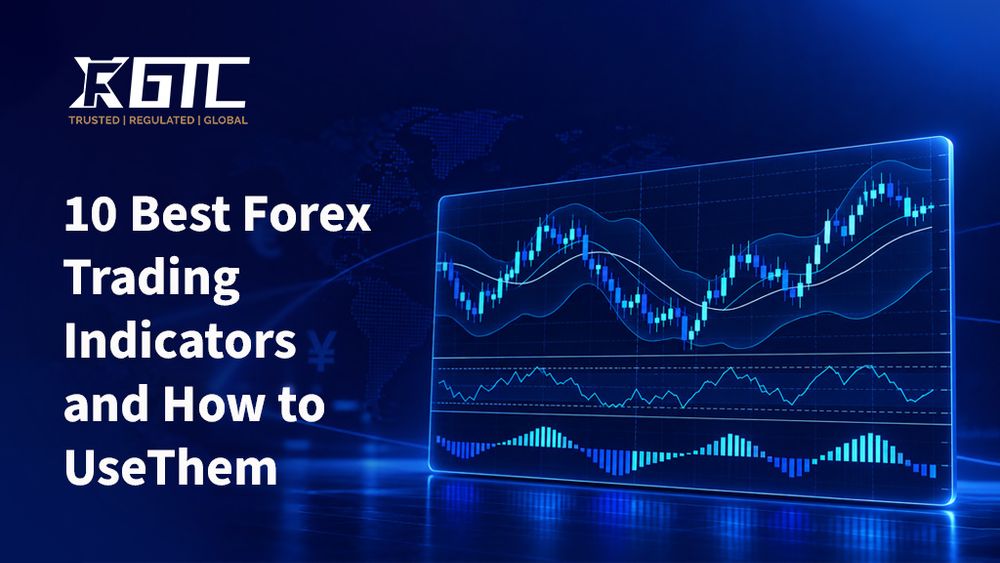
10 Best Forex Trading Indicators and How to Use Them

From identifying trends and momentum to measuring volatility and potential reversals, the right indicators can help you make more informed decisions.

  • 8 min read
  • For traders
  • Technical Analysis
10 Best Forex Trading Indicators and How to Use Them
01SECTION 01

What Makes Trading Indicators Useful for Market Analysis?

In forex trading, timing can make the difference between a smart entry and a costly mistake. But with prices moving constantly, how can traders spot meaningful opportunities without relying on guesswork? That's where forex trading indicators come in. From identifying trends and momentum to measuring volatility and potential reversals, the right indicators can help you make more informed decisions.

In this guide, we'll explore 10 of the best forex trading indicators and show you how to use them effectively.

Technical indicators process historical price data and volume to help traders make objective decisions. Rather than relying on intuition, traders use these tools to clarify chart patterns and confirm entries.

Indicators generally fall into four core categories:

📈

Trend Indicators

Identify the overall direction of price movement, helping traders determine whether a market is trending upward, downward, or moving sideways.

⚡

Momentum Indicators

Measure the speed and strength of price changes to highlight potential overbought or oversold market conditions.

🔄

Volatility Indicators

Track the rate and magnitude of price fluctuations, assisting traders in adjusting stop-loss levels and managing risk.

💪

Trend-Strength Indicators

Gauge the intensity of an existing trend to show whether market momentum is strengthening or weakening.

02SECTION 02

10 Best Technical Indicators for Smart Trading Strategy

01

Moving Average (MA)

What it measures: Calculates the average price over a set period to smooth out short-term price fluctuations.

How to use it: Simple Moving Averages (SMA) and Exponential Moving Averages (EMA) help identify trend direction. A rising moving average signals an uptrend, while a falling average indicates a downtrend. Crossovers between short-term and long-term moving averages often signal potential entry points.

02

Relative Strength Index (RSI)

What it measures: Measures the speed and change of price movements on a scale from 0 to 100.

How to use it: Readings above 70 suggest an overbought market where price may pull back. Readings below 30 indicate oversold conditions where a price bounce could occur. RSI divergence also alerts traders to potential trend fatigue.

03

Moving Average Convergence Divergence (MACD)

What it measures: Tracks the relationship between two moving averages to show trend momentum.

How to use it: The MACD line crossing above the signal line gives a bullish signal, while crossing below indicates bearish momentum. The accompanying histogram displays the distance between the lines, reflecting momentum intensity.

04

Bollinger Bands

What it measures: Assesses market volatility using a middle moving average bounded by upper and lower standard deviation lines.

How to use it: Bands expand during high volatility and contract during low volatility. Price touching the upper band suggests overextended conditions, while touching the lower band hints at undervaluation. Band squeezes often precede strong breakout moves.

05

Stochastic Oscillator

What it measures: Compares a specific closing price to a range of prices over a given timeframe.

How to use it: Operating between 0 and 100, values above 80 signal overbought conditions, while values below 20 signal oversold conditions. It is recognized as one of the best indicators for day trading when seeking turning points in range-bound markets.

06

Average True Range (ATR)

What it measures: Measures market volatility by calculating the average range between high and low prices over a specific period.

How to use it: ATR does not predict price direction, but higher values indicate higher volatility. Traders use ATR to set realistic take-profit targets and adjust stop-loss orders according to market noise.

07

Average Directional Index (ADX)

What it measures: Evaluates the strength of an active trend without indicating its direction.

How to use it: An ADX value above 25 signals a strong trend suitable for trend-following tactics. An ADX value below 20 suggests a weak or ranging market where trend strategies may fail.

08

Ichimoku Cloud

What it measures: Provides a comprehensive view of support, resistance, trend direction, and momentum.

How to use it: Prices above the cloud signal a bullish environment, while prices below the cloud signal a bearish trend. The cloud thickness indicates the strength of support or resistance levels.

09

Parabolic SAR

What it measures: Identifies potential reversal points and trailing stop levels.

How to use it: Dots positioned below price bars signal an uptrend, while dots above signal a downtrend. When the dots flip position, traders consider exiting or reversing their positions.

10

Commodity Channel Index (CCI)

What it measures: Measures the current price level relative to an average price level over a given period.

How to use it: Values above +100 point to strong uptrends or overbought status, whereas values below -100 point to strong downtrends or oversold status.

03SECTION 03

Combining the Best Technical Indicators for Stocks and Forex

Using multiple indicators that measure identical market characteristics can create redundant signals. For instance, combining RSI with Stochastic may give double confirmations that offer no new information. A smarter approach relies on combining complementary tools from different analytical categories.

Here are effective indicator combinations:

🔄

Moving Average + RSI

The moving average establishes the primary trend direction, while RSI pinpoints optimal entry timing by tracking momentum.

📈

MACD + Bollinger Bands

MACD reveals momentum shifts, while Bollinger Bands highlight volatility spikes and potential breakout boundaries.

💪

ADX + Moving Average

Moving averages define direction, while ADX verifies whether the trend has sufficient strength to justify a trade.

⚡

ATR + Trend Indicator

A trend indicator guides your trade direction, while ATR informs volatility-based position sizing and stop-loss placement.

Effective indicator combinations should confirm an underlying market context rather than simply generating a high volume of conflicting trading signals.

04SECTION 04

Trade Forex with GTCFX

Applying technical tools effectively requires access to top-tier execution and advanced trading platforms. GTCFX provides a robust environment designed to support both beginner and experienced traders across global financial markets.

Why traders choose GTCFX:

01

Advanced Trading Platforms

Access industry-standard platforms including MetaTrader 4 (MT4), MetaTrader 5 (MT5), and the GTC Go mobile app for seamlessly tracking chart indicators.

02

Competitive Trading Conditions

Enjoy tight spreads starting from 0.0 pips on ECN accounts, fast order execution, and flexible leverage options up to 1:2000.

03

Diverse Market Access

Trade currency pairs alongside metals, indices, commodities, and stock CFDs from a single account.

04

Regulated Security

Benefit from segregated client funds, transparent operational standards, and 24/5 customer support.

05

Risk-Free Practice

Open a GTCFX demo account to test custom indicator strategies using virtual capital before trading live markets.

Ready to enhance your chart analysis? Explore live and demo account options with GTCFX today to trade global markets with confidence.

Risk Warning

This content is for educational purposes only and does not constitute financial advice. Trading involves significant risk, and you may lose your capital.

GTCFX operates as a multi-regulated group of companies. Clients are kindly advised to confirm the specific legal entity, regulation and jurisdiction under which they are being onboarded.

Compartir este artículo

Más de Blogs

How to Make a Forex Withdrawal on GTC Go (GTCFX Guide)?

Blogs

How to Make a Forex Withdrawal on GTC Go (GTCFX Guide)?

GTC Go is GTCFX's mobile trading app, giving traders quick access to accounts, markets, and fund management. As a regulated forex broker, GTCFX aims to make every forex withdrawal on GTC Go simple and secure.

How to Deposit Money into GTCFX-A Step-by-Step Guide?

Blogs

How to Deposit Money into GTCFX-A Step-by-Step Guide?

Depositing funds into your trading account is an essential step before you start trading with GTCFX. This guide explains how to deposit money into GTCFX, including available payment methods, processing times, fees, and key considerations to help you complete your deposit smoothly.

When Does Forex Market Open? (2026 Update)

Blogs

When Does Forex Market Open? (2026 Update)

Learn when the forex market opens and closes, how Sydney, Tokyo, London and New York sessions work, and how overlaps, DST and holidays affect trading activity.

What Is the Strongest Currency in the World?

Blogs

What Is the Strongest Currency in the World?

Explore the strongest currencies in 2026 by nominal value, including the Kuwaiti dinar, Bahraini dinar, Omani rial, Jordanian dinar and British pound, plus the factors that influence currency strength and forex trading.

How to Trade Oil CFDs: A Step-by-Step Guide for Beginners

Blogs

How to Trade Oil CFDs: A Step-by-Step Guide for Beginners

When you trade an oil CFD you take a position on a crude futures price without owning or receiving any oil. Three things decide whether the trade works: understanding what moves the price, sizing the position for oil's daily range rather than a currency pair's, and knowing what happens when the underlying contract expires.

Your First Step Into Indices Trading-What New Traders Should Know Before Starting

Blogs

Your First Step Into Indices Trading-What New Traders Should Know Before Starting

Indices trading can look appealing to beginners because a single trade can provide exposure to a broad group of companies rather than one individual stock. But before placing your first order, it is important to understand how indices work, what moves their prices, and how leverage can affect both gains and losses.

Forex Spread Explained: What You Really Pay Per Trade

Blogs

Forex Spread Explained: What You Really Pay Per Trade

The spread is the gap between the price you can buy at and the price you can sell at, and you pay it on every trade. In money terms it is (spread in pips) x (pip value for your lot size). On top of it sit commission, overnight financing and a handful of charges that never appear in the quote. Which of these dominates depends entirely on how long you hold positions.

Cómo activar la modalidad sin swaps: rápido y transparente

La activación es sencillaContacta con nosotros y nuestro equipo especializado se encargará del resto. Sin papeleo ni pasos ocultos, solo una solicitud sencilla.
¿Cómo activar la modalidad sin swaps?Contacta con nuestro equipo de soporte a través del chat en vivo o por correo electrónico. Revisaremos tu elegibilidad y activaremos la modalidad sin swaps en tu cuenta una vez confirmada.